
_and_the_final_int.tiff)
_and_the_2-week_po.tiff)
Introduction
Proper alignment of the knee after total knee replacement is critical in maximizing implant survival (Ritter et al. 2011). Unfortunately, there can be a substantial rate of knees that do not meet acceptable alignment after conventional total knee arthroplasty (Ritter et al. 2011; Teter et al. 1995). Poorly aligned total knees may result in increased polyethylene wear, worse patient outcomes, and decreased length of implant survival (Collier et al. 2007; Duran-Serrano et al. 2023; Liu et al. 2016; Mason et al. 2007; Kazarian et al. 2019).
Robotically-assisted total knee arthroplasty was developed to improve the accuracy of restoring anatomic alignment and patient outcomes. Whereas it is less clear if robotic-assisted total knee arthroplasty provides improved outcomes in its current state, multiple studies demonstrated increased accuracy of restoring the desired alignment (Liow et al. 2014; Kim et al. 2020; Agarwal et al. 2020; Ren et al. 2019; Onggo et al. 2020; Bensa et al. 2023; Ruangsomboon et al. 2023; Mannan et al. 2018).
Several studies exist that examine the accuracy of the Rosa robotic system (Zimmer, Warsaw, IN) in restoring the desired mechanical axis (MA) (Parratte et al. 2019; Seidenstein et al. 2021; Rossi et al. 2023; Shin et al. 2022; Batailler et al. 2023; Hasegawa et al. 2022; Petrillo et al. 2025; Duchniewicz et al. 2025; Zaidi et al. 2024). The ROSA system can be used in either 1) an imageless mode (with no specific pre-operative imaging) and 2) an image-based mode that utilizes preoperative, standing long-leg radiographs with calibration markers (Mayne et al. 2024). Theoretically, the image-based mode is used to increase the accuracy of calibrating the robot to the location of bony anatomic landmarks. To the best of knowledge, studies that examine the accuracy of the image-based method of planning and reproducing the desired MA are rare (Hasegawa et al. 2022; Duchniewicz et al. 2025; Narkbunnam et al. 2025).
The primary hypothesis of the study was that the intraoperative, ROSA-imaged-based, robotic measurements will correlate with the preoperatively and postoperatively radiographically-measured MAs. Secondary hypotheses included 1) the planned MA would correlate and have a high degree of accuracy with the a) intraoperative MA and b) the postoperative radiographic MA, 2) the variance of mechanical axis measurements and the incidence of outliers would be less postoperatively compared to preoperatively when comparing radiographic vs robotic MA measurements and 3) there would be no difference in the accuracy of obtaining the planned MA postoperatively based on the type of preoperative malalignment (varus/valgus).
Methods
After institutional review board approval was obtained (#USD IRB-24-99), a retrospective review was performed on patients undergoing robotically-assisted total knee arthroplasty after the principal investigator had performed cadaveric training on the robotic technique. The first eight cases were not included to account for the learning curve (Petrillo et al. 2025; Zaidi et al. 2024; Vanlommel et al. 2021; Bolam et al. 2022; Savov et al. 2021; Vermue et al. 2022). Inclusion criteria were patients undergoing an imaged-based total knee arthroplasty that utilized preoperative long-leg standing radiographs with calibration markers that assisted in landmarking the bony anatomy intraoperatively (Mayne et al. 2024). Exclusion criteria included patients undergoing conventional total knee arthroplasty without robotic assistance, patients undergoing imageless robotic total knee arthroplasty, or patients without preoperative and postoperative long leg standing radiographs. Prosthetic implants and postoperative rehabilitation were standardized across all patients.
Six measurements were analyzed: 1) preoperative, radiographically-determined, native MA (PreopRadMA), 2) preoperative industry/software-determined, native MA (PreopSoftMA), 3) the robotically-determined, native MA (PreopRobMA), 4) the intraoperatively-planned MA (PlanMA), 5) the final intraoperative MA after-implant-cementation (IntraopMA), and 6) the 2-week postoperative, radiographic, standing MA (PostopRadMA).
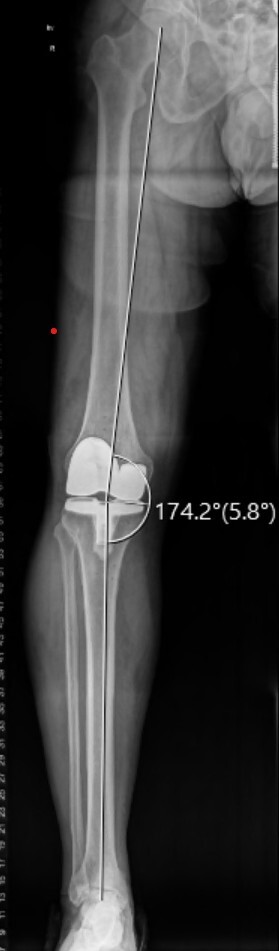
The PreopRadMA and PostopRadMA were measured on a Picture Archiving Communication System (PACS) [Sectra, Linköping, Sweden] preoperatively and at the two-week postoperative visit, respectively, by subtending an angle from a line drawn from the center of the femoral head to the intercondylar notch of the tibial plateau and a line from the intercondylar notch of the tibial plateau to the middle of the ankle in the coronal view (also known as the hip-knee-ankle angle [Cherian et al. 2014]) (Roche et al. 2023; Babazadeh et al. 2013). These measurements were performed by the author who is a fellowship-trained orthopaedic surgeon with greater than 18 years of experience. When performing these measurements, the investigator was blinded to all other measurements.
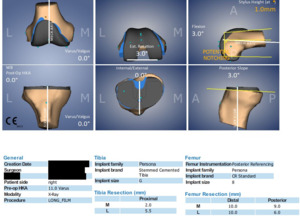
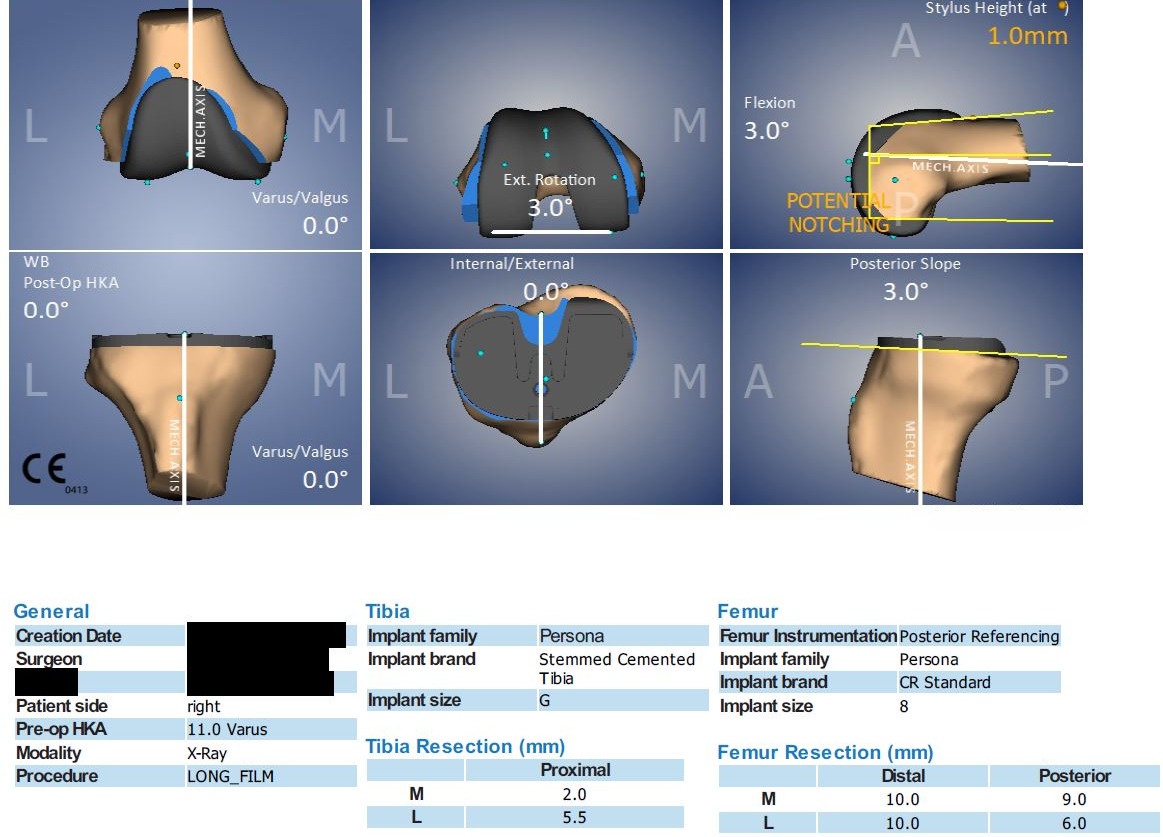
The PreopSoftMA was measured by a prosthetic industry engineer employed using a proprietary, computer software program [X-Atlas®] to measure the same preoperative radiographs (Zimmer-Biomet, n.d.). Determination of this measurement is a routine service provided to the surgeon when utilizing the image-guided technique [Figure 1].
The PlanMA was the desired goal for the postoperative MA chosen by the surgeon either preoperatively or intraoperatively. The PreopRobMA and the IntraopMA were determined by the interface between the robot and the trackers that were rigidly fixed to the femur and tibia intraoperatively.
Variances were defined as the mean of the absolute differences between mechanical axis measurements [Figure 2]. Absolute differences were utilized to determine the true magnitude of the differences since the differences could be bi-directional (varus or valgus). Directional bias was accounted for by the Bland Altman analysis that determined agreement between techniques and 95% limits of agreement. An outlier was defined when there was greater than 3⁰ difference between MA measurements. Three degrees has been the historic gold standard for determining outliers in mechanical axis alignment measurement (Jeffery et al. 1991). A Student’s t-test was utilized to determine statistical difference between means. Chi-square testing was utilized to analyze categorical variables. Intraclass correlation coefficients were calculated using a two-way mixed-effects model for absolute agreement and single measurements (ICC [3,1]) to assess agreement between measurement methods. Ninety-five percent confidence intervals were computed for each ICC estimate. Agreement was interpreted using established thresholds (<0.5 poor, 0.5–0.75 moderate, 0.75–0.9 good, >0.9 excellent).
_and_the_postoperat.jpeg)
Results
One-hundred and forty-five patients underwent total knee arthroplasty between July 21, 2021 and April 24, 2024. Sixteen patients underwent conventional total knee arthroplasty without robotic assistance. Six patients underwent robotic total knee arthroplasty but were not able to get postoperative standing radiographs. Three patients underwent imageless robotic total knee arthroplasty. One-hundred and twenty patients met inclusion and exclusion criteria.
The mean PreopRadMA was 176.6+6.3⁰ (165-192⁰). The mean PreopSoftMA was 174.8+6.9⁰ (range 160-195). The mean PreopRobMA was 176.9+4.4⁰ (range 168-191) The mean PlanMA was 179.9+1.0⁰ (range 177-182.5). The mean IntraopMA was 178.8+1.8⁰ (range 173.6-184.5). The mean PostopRadMA was 179.0+2.1⁰ (range 173.4 – 184.3) with 39 knees (33%) in more valgus than planned, 72 knees (60%) in more varus than planned, and 9 knees (8%) were aligned as exactly as planned.
PreopRadMA vs PreopSoftMA
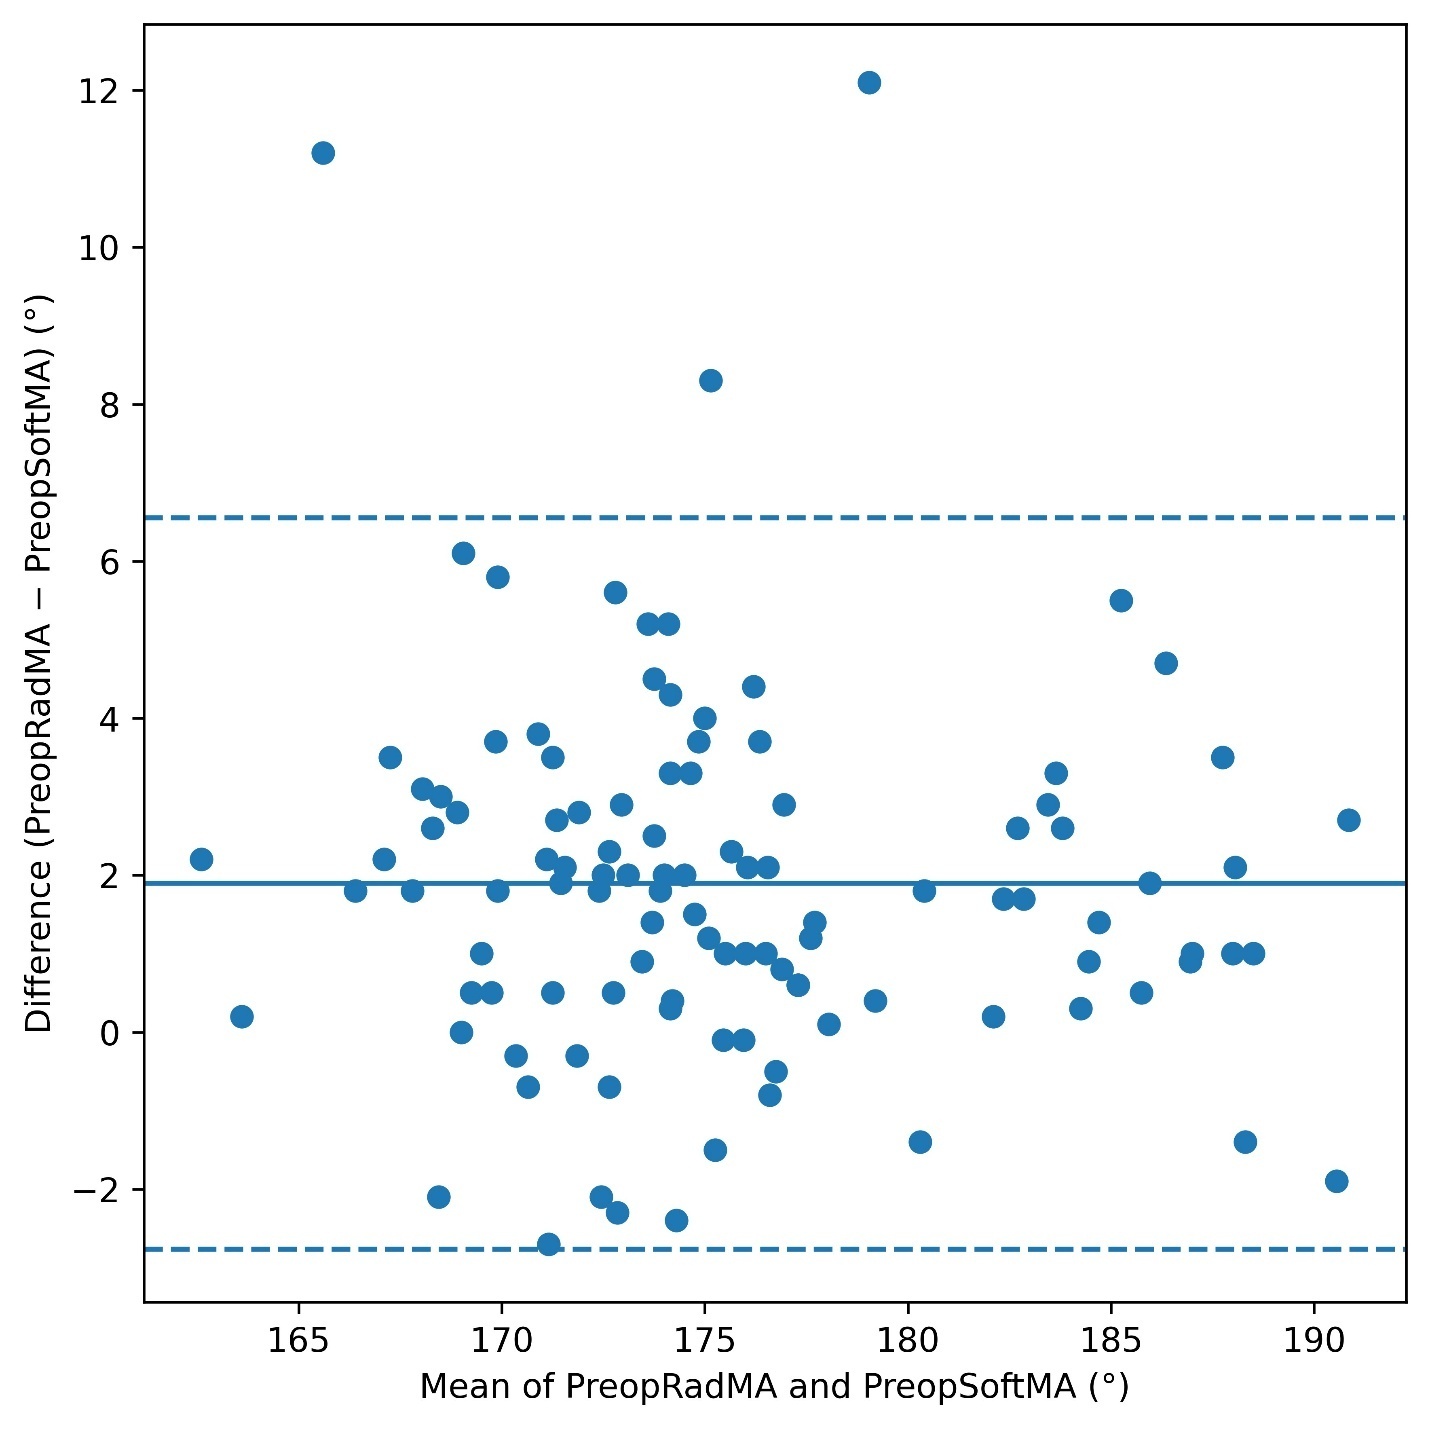
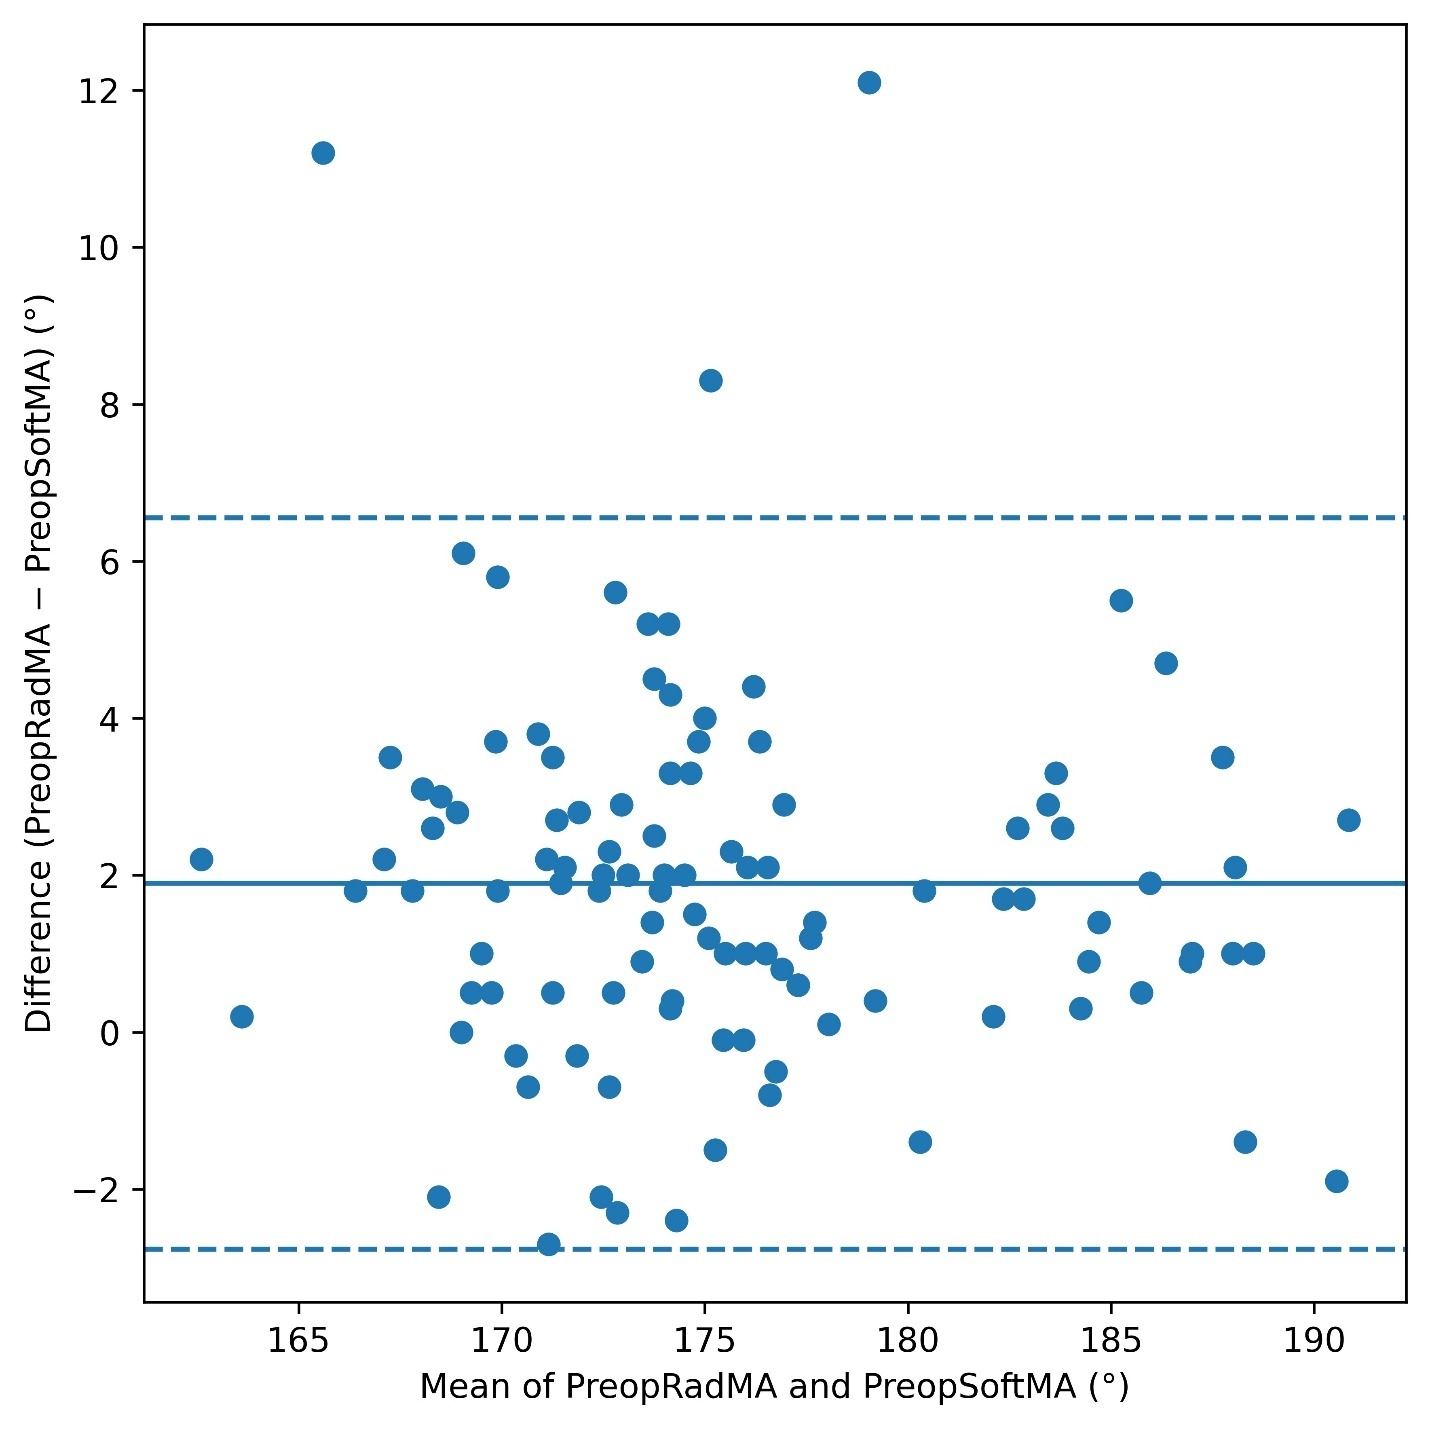
Agreement between preoperative radiographic and software mechanical axis measurements was excellent (ICC [3,1] = 0.93; 95% CI, 0.90–0.95). Bland–Altman analysis demonstrated a mean difference of 1.90° between PreopRadMA and PreopSoftMA, indicating a small systematic valgus bias of the radiographic measurements compared to the industry software measurements. The 95% limits of agreement ranged from −2.76° to +6.56°, reflecting an overall agreement interval of approximately 9.3° [Figure 3]. The mean absolute difference between the PreopRadMA and the PreopSoftMA was 2.3+2.0⁰. Twenty-three percent had greater than 3⁰ difference between measurements. When comparing the variances between these measurements and that of the PreopRobMA, the PreopRadMA was more precise compared to the PreopSoftMA (2.8+2.0⁰ vs 3.3+2.3⁰; p=0.047) although the percentage of outliers were similar (40% vs 50%; p=0.14).
PreopRadMA vs PreopRobMA
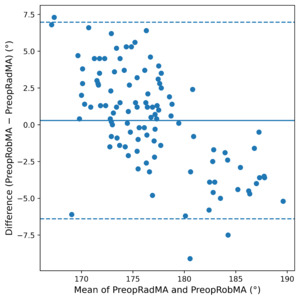
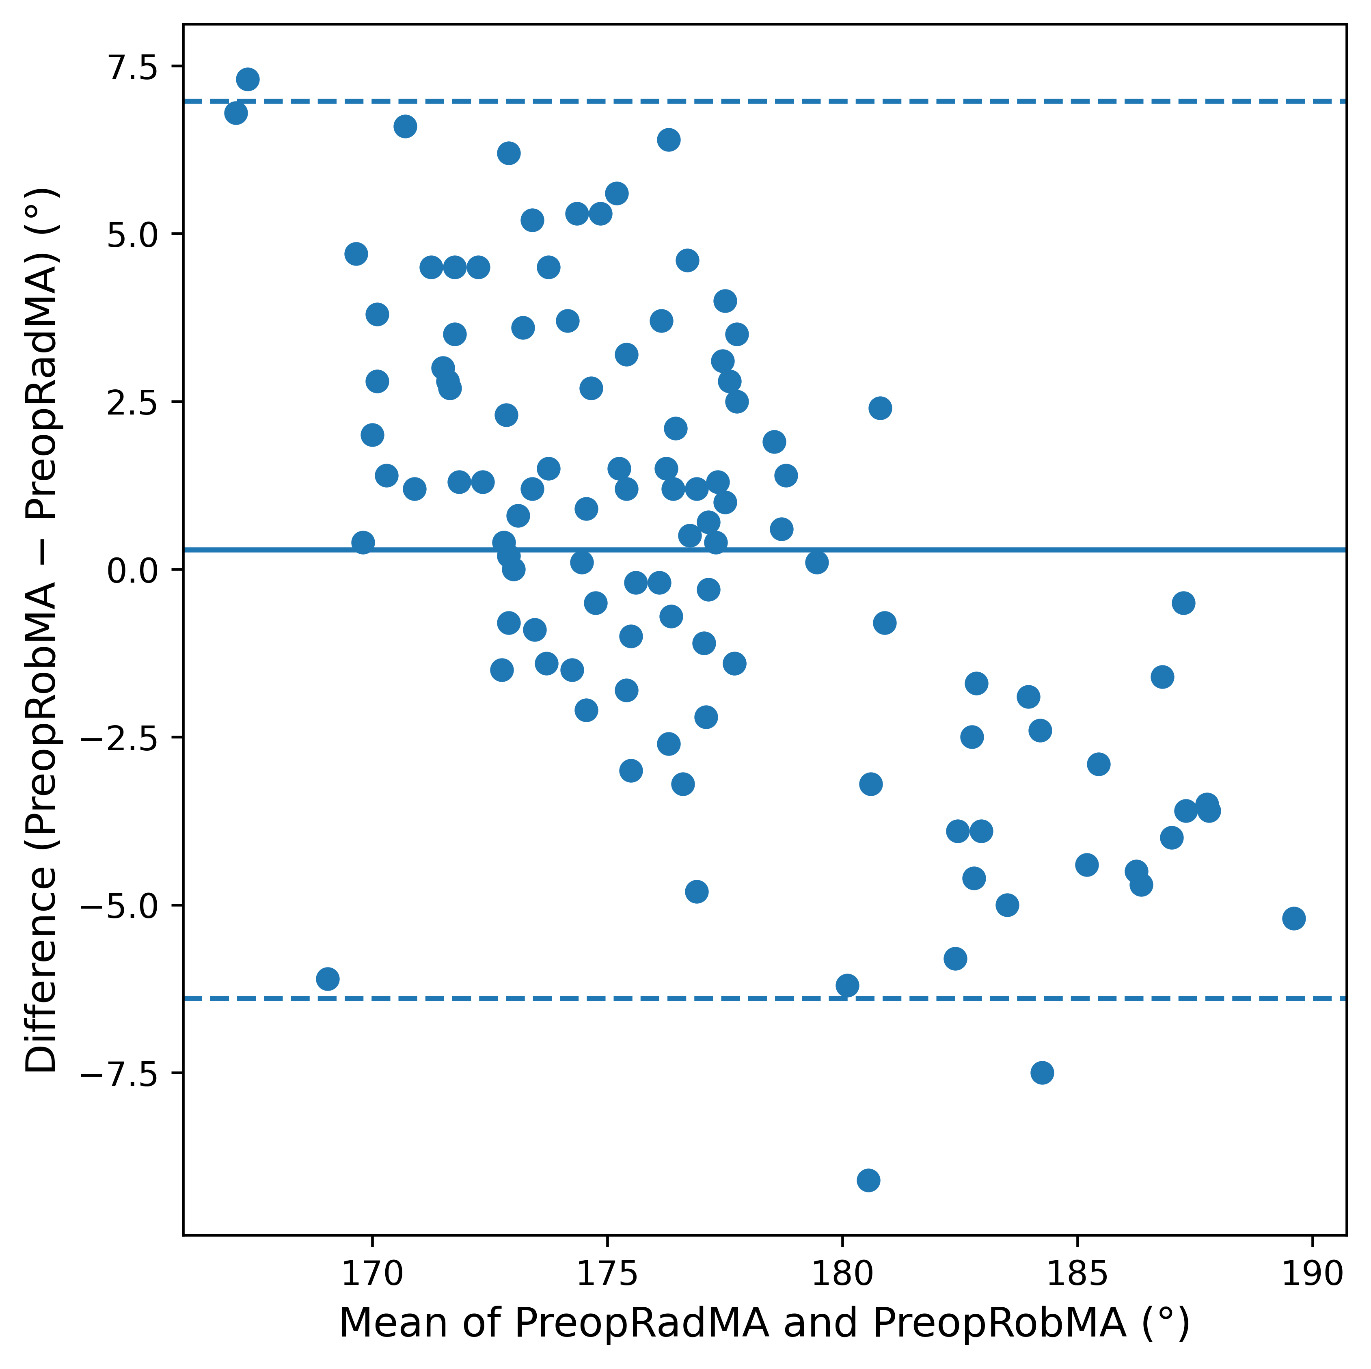
Agreement between preoperative radiographic and robotic mechanical axis measurements was excellent (ICC [3,1] = 0.92; 95% CI, 0.88–0.94), and the mean values were statistically similar (p=0.38). Bland–Altman analysis demonstrated a mean difference of 0.29° between PreopRobMA and PreopRadMA, indicating minimal systematic bias. The 95% limits of agreement ranged from −6.39° to +6.97°, reflecting an overall agreement interval of approximately 13.4° [Figure 4]. The mean absolute difference between the PreopRadMA and the PreopRobMA was 2.8+2.0⁰.
PreopSoftMA vs PreopRobMA
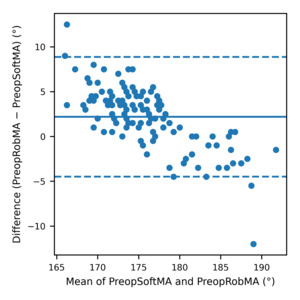
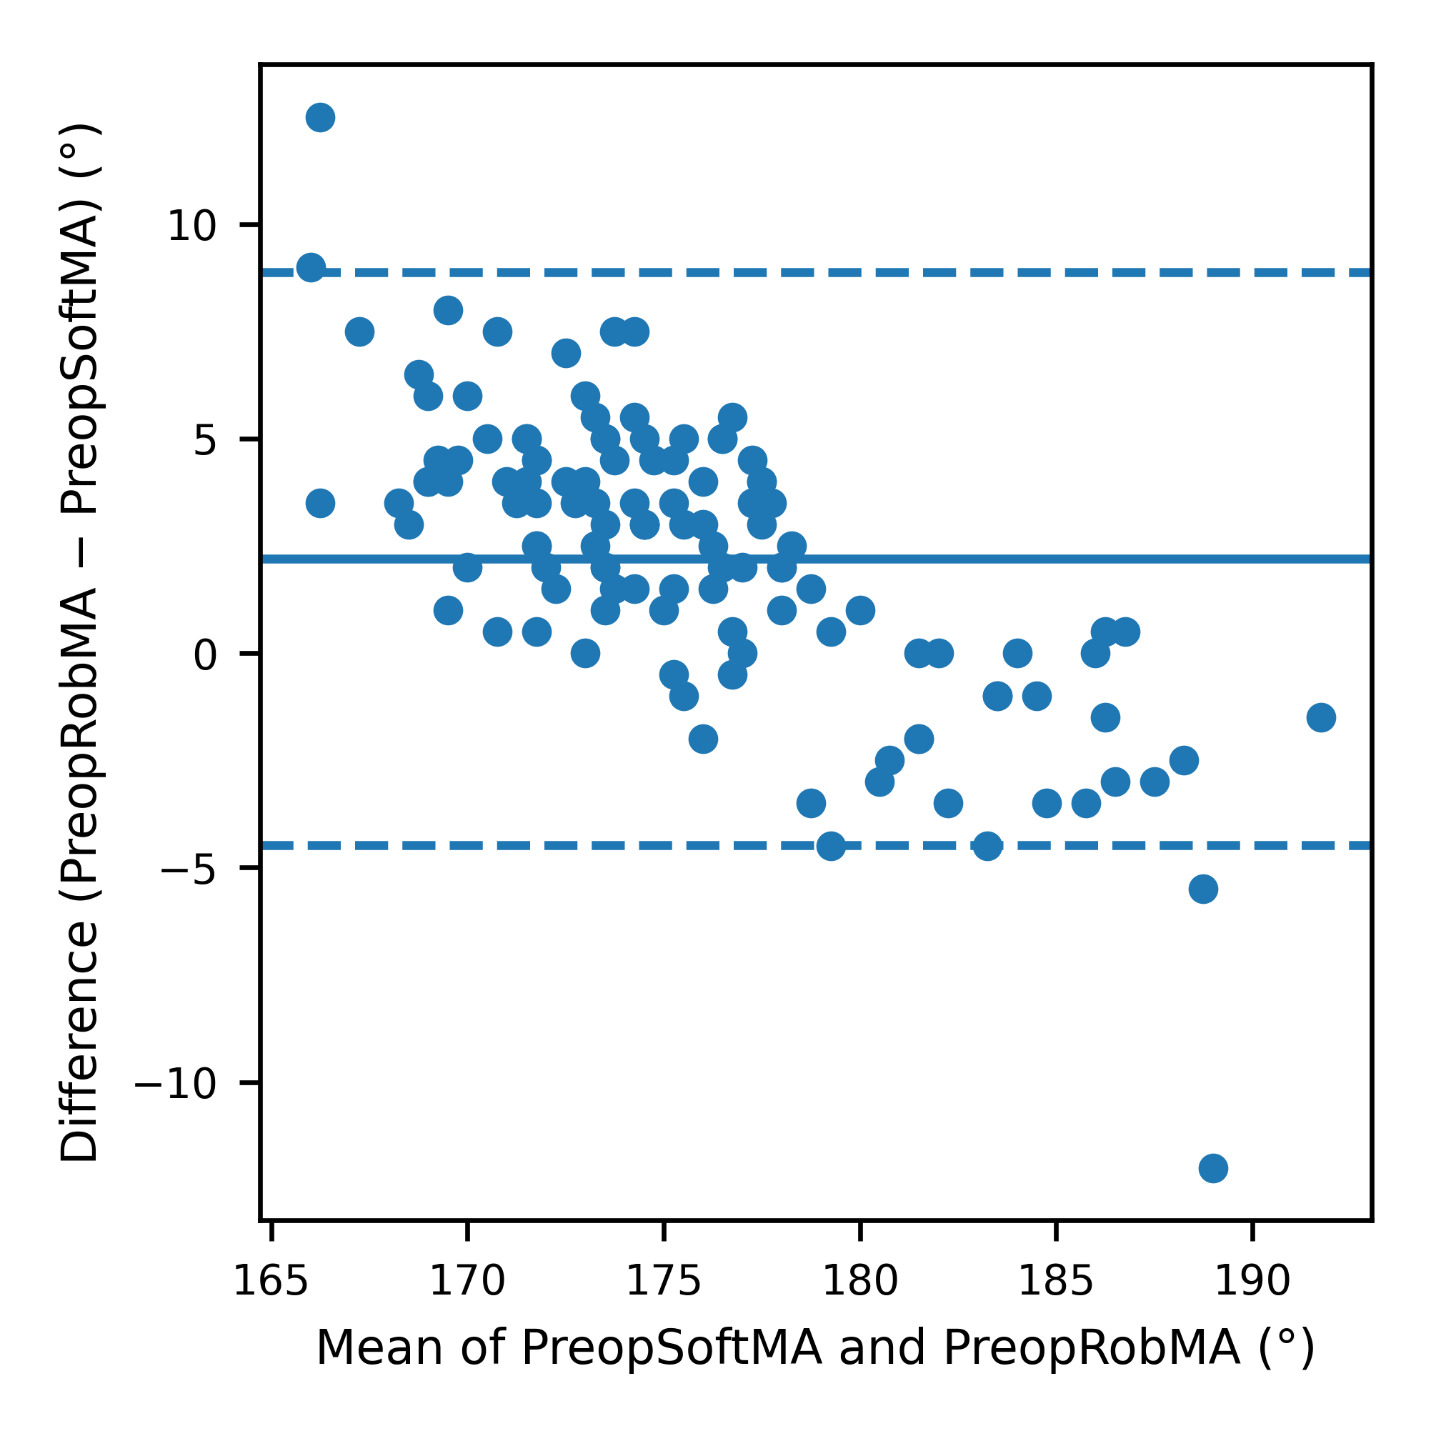
Agreement between preoperative software-derived and robotic mechanical axis measurements was excellent (ICC [3,1] = 0.91; 95% CI, 0.87–0.93) although there was a statistically significant difference between their mean values (p<0.0001). Bland–Altman analysis demonstrated a mean difference of 2.2°, indicating a small systematic bias toward more valgus measurements with the robotic MA measurement. The 95% limits of agreement ranged from −4.5° to 8.9°, yielding a total agreement span of approximately 13.4° [Figure 5]. The mean absolute difference was 3.3+2.3⁰.
PlanMA vs IntraopMA
Agreement between planned mechanical axis and intraoperative mechanical axis measurements was poor (ICC [3,1] = 0.42; 95% CI, 0.27–0.55) and there was a statistically significant difference between their mean values (p<0.0001). Nineteen knees (16%) were aligned in more valgus than planned, 84 (71%) knees were aligned in more varus than planned, and 16 knees (13%) were aligned exactly as planned. A Bland–Altman analysis demonstrated a mean difference of −1.0° between IntraopMA and Plan MA, indicating a slight systematic shift toward varus for the IntraopMA. The 95% limits of agreement ranged from −3.9° to +1.8°, reflecting an overall agreement span of approximately 5.7° [Figure 6]. The mean absolute difference of IntraopMA from the PlanMA was 1.4+1.1⁰. Only 5 knees (4%) had greater than 3⁰ of deviation of the IntraopMA from the PlanMA.
_and_the_final_int.tiff)
Plan MA vs PostopRadMA
Agreement between planned mechanical axis and the postoperative radiographic mechanical axis was moderate (ICC [3,1] = 0.51; 95% CI, 0.37-0.63) although there was a statistically significant difference between their mean values (p<0.0001). A Bland–Altman analysis demonstrated a mean difference of −0.83° between PostopRadMA and Plan MA, indicating a slight systematic shift toward varus postoperatively. The 95% limits of agreement ranged from −4.55° to +2.90°, reflecting an overall agreement span of approximately 7.5° [Figure 7]. The mean absolute difference of the PostopRadMA from the Plan MA was 1.6+1.3⁰. Seventeen knees (14%) had greater than 3⁰ of deviation of the PostopRadMA compared to the PlanMA.
_and_the_2-week_po.tiff)
IntraopMA vs PostopRadMA
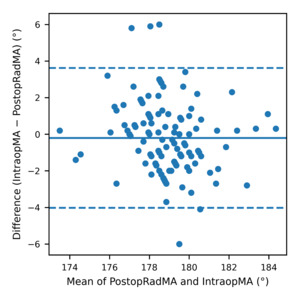
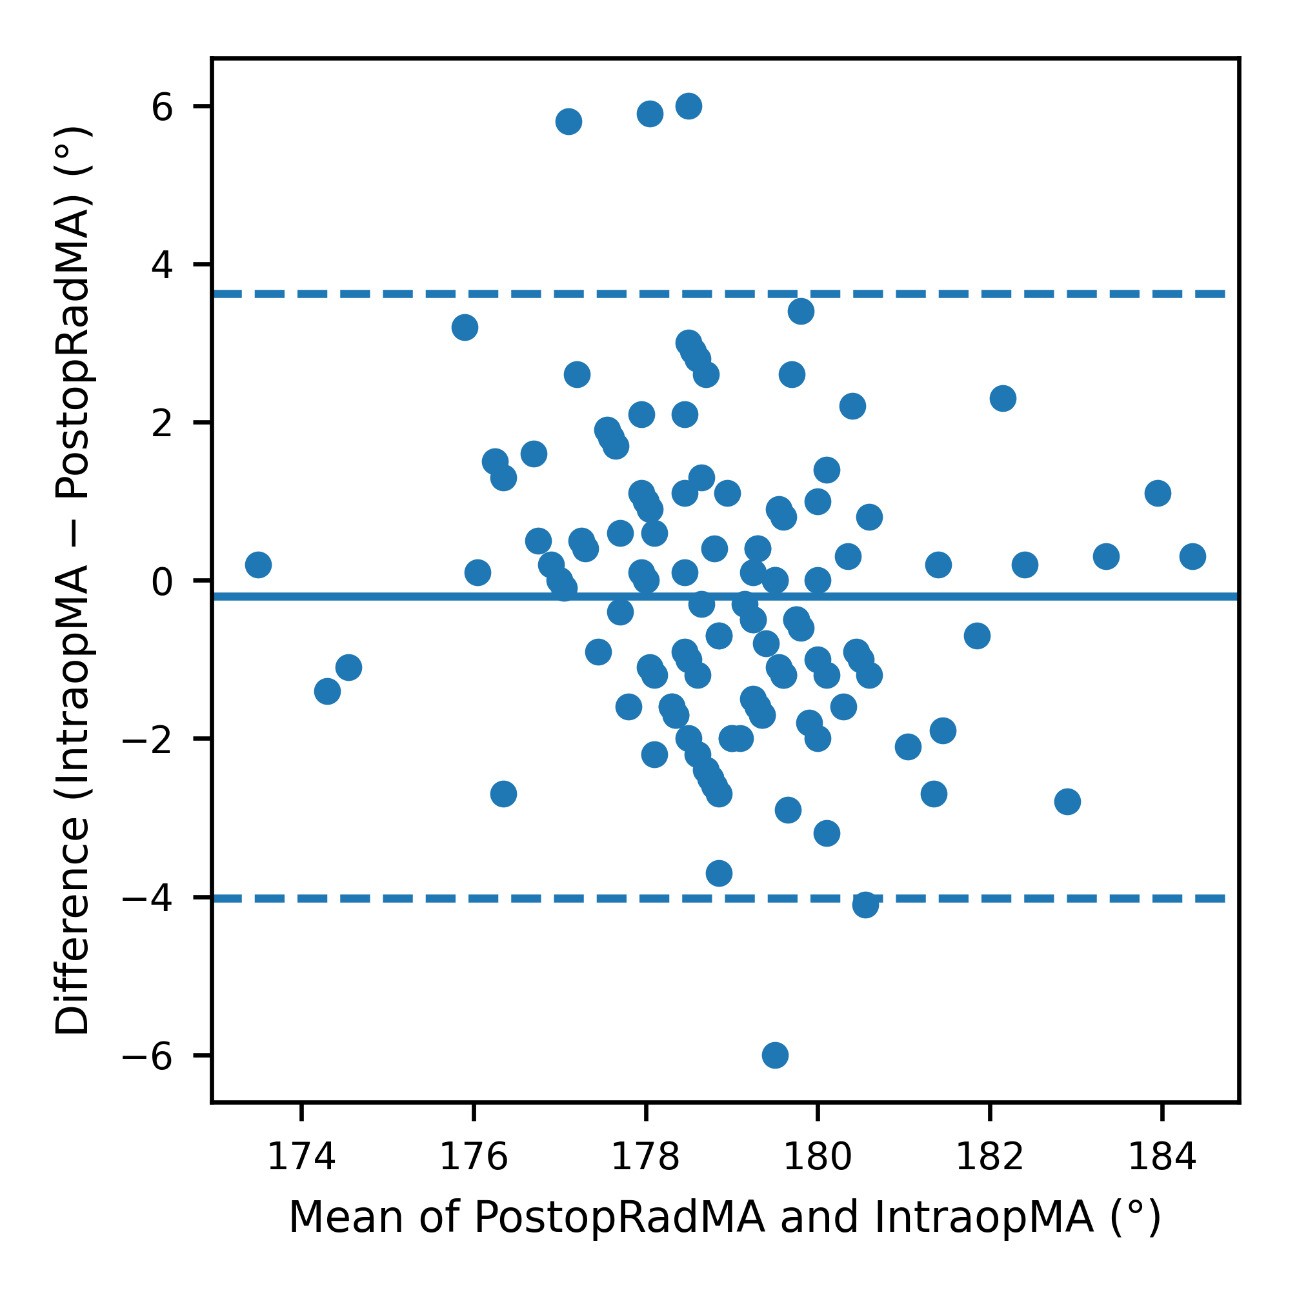
Agreement between postoperative radiographic and intraoperative mechanical axis measurements was good to excellent (ICC [3,1] = 0.88; 95% CI, 0.83–0.92) and there was no significant difference between their mean values (p=0.27). A Bland–Altman analysis demonstrated a mean difference of −0.20° between IntraopMA and PostopRadMA, indicating minimal systematic bias. The 95% limits of agreement ranged from −4.02° to +3.62°, corresponding to an overall agreement span of approximately 7.6° [Figure 8]. The mean absolute difference of the PostopRadMA and the IntraopMA was 1.5+1.2⁰. Nine knees (8%) had greater than 3⁰ of deviation of the PostopRadMA compared to the IntraopMA.
Accuracy of the PlanMA compared to the IntraopMA vs the PlanMA compared to the PostopRadMA
There were no statistically significant findings in the mean absolute differences between the 1) Plan MA and the IntraopMA (1.5+1.3⁰) and 2) the PlanMA and the PostopRadMA (1.6+1.3⁰; p=0.22). However, there was a statistically higher chance of having a greater than 3⁰ outlier between the Plan MA and the PostopRadMA compared to the Plan MA and the IntraopMA (14% vs 4%; p=0.008).
Preoperative Measurements vs Postoperative Measurements
There were greater variances in MA measurements when comparing the preoperative vs intraoperative measurements compared to the intraoperative vs postoperative MA measurements. Specifically, there were statistically significantly greater mean absolute differences between the 1) PreopRadMA and the PreopRobMA (2.8+2.0 p<0.0001) and 2) PreopSoftMA and the PreopRobMA (3.3+2.2⁰; p<0.0001) compared to the mean absolute differences between the PostopRadMA and the IntraopMA (1.5+1.2⁰). In addition, there were significantly greater rate of outliers found between the 1) PreopRadMA and PreopRobMA (40%; p<0.0001) and 2) PreopSoftMA and the PreopRobMA (50%; p<0.0001) compared with the PostopRadMA and IntraopMA (8%).
Effect of Preoperative Alignment (Varus vs Valgus)
When examining the type of preoperative deformity, there was no difference between the accuracy of the PlanMA and the PostopRadMA in varus compared to valgus knees (1.6+1.4⁰ vs 1.4+1.3⁰; p=0.37). In addition, there was no difference between the accuracy of the IntraopMA and the PostopRadMA in varus compared to valgus knees (1.5+1.2⁰ vs 1.4+1.3⁰; p=0.63).
Discussion
Intraclass correlation analysis demonstrated excellent agreement among preoperative measurement modalities. In contrast, agreement between the planned mechanical axis and both intraoperative and postoperative measurements were lower indicating only poor-to-moderate agreement. The agreement improved substantially when comparing intraoperative measurements with postoperative radiographic alignment reflecting strong concordance between intraoperative alignment and final radiographic outcomes. In contrast, preoperative measurements had 1) higher agreement spans, 2) higher absolute mean differences and 3) greater numbers of outliers compared to intraoperative and postoperative mechanical axis measurements. This apparent contradiction was consistent with the range restriction effect on the ICC. The ICC increases when sample heterogeneity is high (broad variability in native limb alignment) and decreases when variability is compressed (postoperative MAs were more tightly clustered consistent with surgical correction toward neutral alignment) (Weir 2005). Collectively, these findings suggest that while preoperative modalities are likely interchangeable for assessment, the intraoperative measurement may be a more clinically relevant predictor of final alignment than the preoperative plan itself.
Other findings of this study include that the preoperative, radiographically-determined MA measurement was statistically more precise than the industry-engineer/software-determined MA when comparing these measurements to the robotically-determined native MA. The robotically-measured native MA tended to underestimate the amount of varus found by both the preoperative radiographic-determined MA and the industry-engineer/software-determined MA. Lastly, there was no difference in the accuracy of obtaining the planned MA postoperatively based on the type of preoperative malalignment (varus/valgus).
To the best of knowledge, this was the first study to examine the relationship of the preoperative, radiographically-determined MA compared to the robotically-determined, native MA. Differences in measurement techniques likely contributed to the measurement variances and the percentage of outliers found in this study. The radiographic measurements were performed weightbearing which accentuates the preoperative deformity compared to the supine, robotic measurement technique. Prior studies have demonstrated a 1.6-2.1⁰ difference in the MA when load was applied (Babazadeh et al. 2013; Panzica et al. 2014; Specogna et al. 2007; Bollars et al. 2020). Postoperatively, there was less variance (1.5⁰) and outliers (8%) between these measurement techniques suggesting that the total knee arthroplasty improves the ligament-balancing over the preoperative, pathologic state (Panzica et al. 2014). Clearly a limitation of robotically-determined mechanical axes is the inability to determine the effect of weightbearing on the mechanical axis.
To the best of knowledge, this was only the second study to determine if a difference exists in native MA measurement accuracy between 1) the radiographically-measured, MA performed by the surgeon and 2) the MA measurement performed by an orthopaedic implant companies’ engineers utilizing a proprietary, software program. Similar to the present study, Duchniewicz et al. demonstrated that the computer software program had a mean mechanical axis 0.83⁰ varus bias compared to the surgeon’s measurement of the preoperative radiographs (Duchniewicz et al. 2025).
To the best of knowledge, this was the first study using ROSA technology that examined the final intraoperative MA once the implants were cemented for accuracy or outliers compared to the planned MA. The final intraoperative measurements showed a MA that was on average more varus than planned. However, this robotic measurement may overestimate the amount of postsurgical varus since the MA measured on the postoperative standing radiographs tended to be in more valgus compared to the MA measured robotically after prosthetic implantation.
Of the four measurements obtained in this study, three were reported in the literature. The mean PreopRadMA in this study (176.6⁰) approximated that of Rossi et al. (176⁰) (Rossi et al. 2023). The mean IntraopMA (178.8⁰) was within the range found in the literature (178-179⁰) (Rossi et al. 2023; Sires and Wilson 2021). The mean PostopRadMA (179⁰) was comparable to those found in other similar studies (177-182) (Rossi et al. 2023; Batailler et al. 2023; Sires and Wilson 2021; Mancino et al. 2023; Schrednitzki et al. 2023; Lau et al. 2023; Thiengwittayaporn et al. 2021; Zhou et al. 2024). The PreopRobMA was not reported in the studies identified examining this topic.
The accuracy of obtaining the planned MA on the postoperative radiographs was 1.6+1.3⁰ which was within the range found in the studies that examine the accuracy of robotic total knee arthroplasty found in the literature (0.4-2.9⁰) (Savov et al. 2021; Vermue et al. 2022; Sires and Wilson 2021; Mancino et al. 2023; Schrednitzki et al. 2023; Zhou et al. 2024; Mancino et al. 2024; Figueroa et al. 2019; Siebert et al. 2002; Nam et al. 2022). The percentage of patients whose postoperative radiographs deviated from the planned MA by greater than 3⁰ in this current study was 14% which was in the range of that found in similar studies (0-30%) (Liow et al. 2014; Hasegawa et al. 2022; Petrillo et al. 2025; Zaidi et al. 2024; Vanlommel et al. 2021; Bollars et al. 2020; Sires and Wilson 2021; Mancino et al. 2023; Schrednitzki et al. 2023; Thiengwittayaporn et al. 2021; Zhou et al. 2024; Nam et al. 2022; Vaidya et al. 2022). No prior studies were found that examined the influence of preoperative deformity on the accuracy of obtaining the planned MA.
In addition to the novel findings, the strengths of this study include that this study was not supported by industry and the author did not have any reimbursements or financial inducements by the company whose technology was examined in this study. The vast majority of published studies supporting robotic arthroplasty have been published by authors receiving financial compensation from industry (Parratte et al. 2019; Seidenstein et al. 2021; Rossi et al. 2023; Schrednitzki et al. 2023; DeFrance et al. 2021). This includes studies that examined the ROSA system (Parratte et al. 2019; Seidenstein et al. 2021; Rossi et al. 2023; Petrillo et al. 2025; Zaidi et al. 2024; Schrednitzki et al. 2023). This has led to a call for studies to be performed without these potential biases (Tompkins et al. 2022).
Limitations of this study and further topics to study include that this study did not compare the accuracy of image-guided robotic total knee arthroplasty vs image-less total knee arthroplasty or if robotic total knee arthroplasty was cost-effective. Standing, long-length radiographs were utilized since they are considered the gold standard for calculating alignment following total knee arthroplasty and do not have the cost or increased radiation exposure of computed tomography (Roche et al. 2023; Babazadeh et al. 2013). A common limitation among studies such as this one was that the X-ray technician taking each radiograph was not controlled although they were well-trained (Shin et al. 2022; Zhou et al. 2024). Another limitation of this study was that reliability studies were not performed for radiographic MA measurements. Since multiple published studies previously demonstrated high rates of inter-observer and intra-observer reliabilities, repeat reliability analyses were not believed to be necessary (Shin et al. 2022; Vermue et al. 2022; Babazadeh et al. 2013; Lau et al. 2023; Mancino et al. 2024; Nam et al. 2022; Nickel et al. 2021). The two-week timing of the postoperative standing-radiographs are a potential limitation compared to later follow up if their standing posture was affected by pain. However, in the author’s experience patients can comfortably stand for these radiographic images at this timepoint. This study also did not determine the sagittal-plane alignment accuracy or the ideal coronal plane alignment. Although 3⁰ is the historic gold standard for determining mechanical axis outliers (Jeffery et al. 1991), more recent studies question it’s validity (Mont, Mahoney, et al. 2010; Parratte et al. 2010). In addition, it is unknown if the mean variances within the MA measurements found within this study (range 1.4+1.1⁰ to 3.3+2.3⁰) are clinically relevant. Lastly, this study did not examine if improved alignment translated into better clinical outcomes and implant survival. Although, examinations of these concerns would have made the study more comprehensive, it did not affect the examination of the hypotheses.