Loading [Contrib]/a11y/accessibility-menu.js

This website uses cookies

We use cookies to enhance your experience and support COUNTER Metrics for transparent reporting of readership statistics. Cookie data is not sold to third parties or used for marketing purposes.

Skip to main content
null
J Orthopaedic Experience & Innovation
  • Menu
  • Articles
    • Brief Report
    • Case Report
    • Conference Proceedings
    • Data Paper
    • Editorial
    • Meeting Reports/Abstracts
    • Methods Article
    • Product Review
    • Research Article
    • Review Article
    • Review Articles
    • Systematic Review
    • All
  • For Authors
  • Editorial Board
  • About
  • Issues
  • Blog
  • "Open Mic" Topic Sessions
  • Advertisers
  • Recorded Content
  • CME
  • JOEI KOL Connect
  • search
  • RSS feed (opens a modal with a link to feed)

RSS Feed

Enter the URL below into your favorite RSS reader.

https://journaloei.scholasticahq.com/feed
ISSN 2691-6541
Research Article
Vol. 7, Issue 1, 2026March 12, 2026 EDT

Impact of Lower Extremity Injuries on Performance Metrics by Position in Male Major League Soccer Players: A Position-Specific Analysis of Return to Play and Performance from 2018-2023

Marcela Treviño, MSHS, MBS, Symone M. Brown, MS, MPH, MBA, Tiffany Lui, BA, BS, Shreya M. Saraf, MS, Mia V. Rumps, MS, Mary K. Mulcahey, MD,
Lower extremity injuriesreturn to playsoccer performanceposition-specific analysisprofessional athletes
Copyright Logoccby-nc-nd-4.0 • https://doi.org/10.60118/001c.146308
J Orthopaedic Experience & Innovation
Treviño, Marcela, Symone M. Brown, Tiffany Lui, Shreya M. Saraf, Mia V. Rumps, and Mary K. Mulcahey. 2026. “Impact of Lower Extremity Injuries on Performance Metrics by Position in Male Major League Soccer Players: A Position-Specific Analysis of Return to Play and Performance from 2018-2023.” Journal of Orthopaedic Experience & Innovation 7 (1). https://doi.org/10.60118/001c.146308.
Download all (1)
  • Figure 1. Location of Defending, Middle, and Attacking Third
    Download

Error

Sorry, something went wrong. Please try again.

If this problem reoccurs, please contact Scholastica Support

Error message:

undefined

View more stats

Abstract

Introduction

Lower extremity injuries are common in male professional soccer players, yet no known studies examine how these injuries impact return to play in these athletes.

Objective

To analyze whether lower extremity injuries affected the rate of return to play and performance in male Major League Soccer players.

Materials/Methods

Injury data from the 2018-2023 men’s professional soccer seasons for both Major League Soccer and International Leagues were collected from FBref, Transfermrkt, and the MLS Player Availability Report. Players were included if they experienced a lower extremity injury during the 2018-2023 soccer seasons. Injuries were included if they resulted in absence from a minimum of 14 days, including games or practices. Performance metrics were analyzed across three periods: short-term, defined as within the same year of injury; medium-term, up to one-year post-injury; and long-term, up to two years post-injury. Statistical analysis comparing performance metrics before and after the injury were conducted using Microsoft excel and Julius. Paired t-tests were used to asses statistical significance.

Results

Of the 1,522 total injuries from 2018-2023, 838 (55.1%) were considered lower extremity injuries. Among all positions, the knee was the most commonly injured structure (151.18%). The Center Back was the most commonly injured position (166 injuries, 19.8%).

Conclusions

Through the data, it was found that the knee was the most injured body part. Center Backs experienced both declines and improvements in performance metrics. Forwards demonstrated a decrease in goals per game and other offensive metrics following injury. These findings can help sports medicine professionals enhance patient recovery, prolong players’ career, and develop targeted injury prevention strategies by understanding the position specific impacts of lower extremity injuries on soccer performance.

Introduction

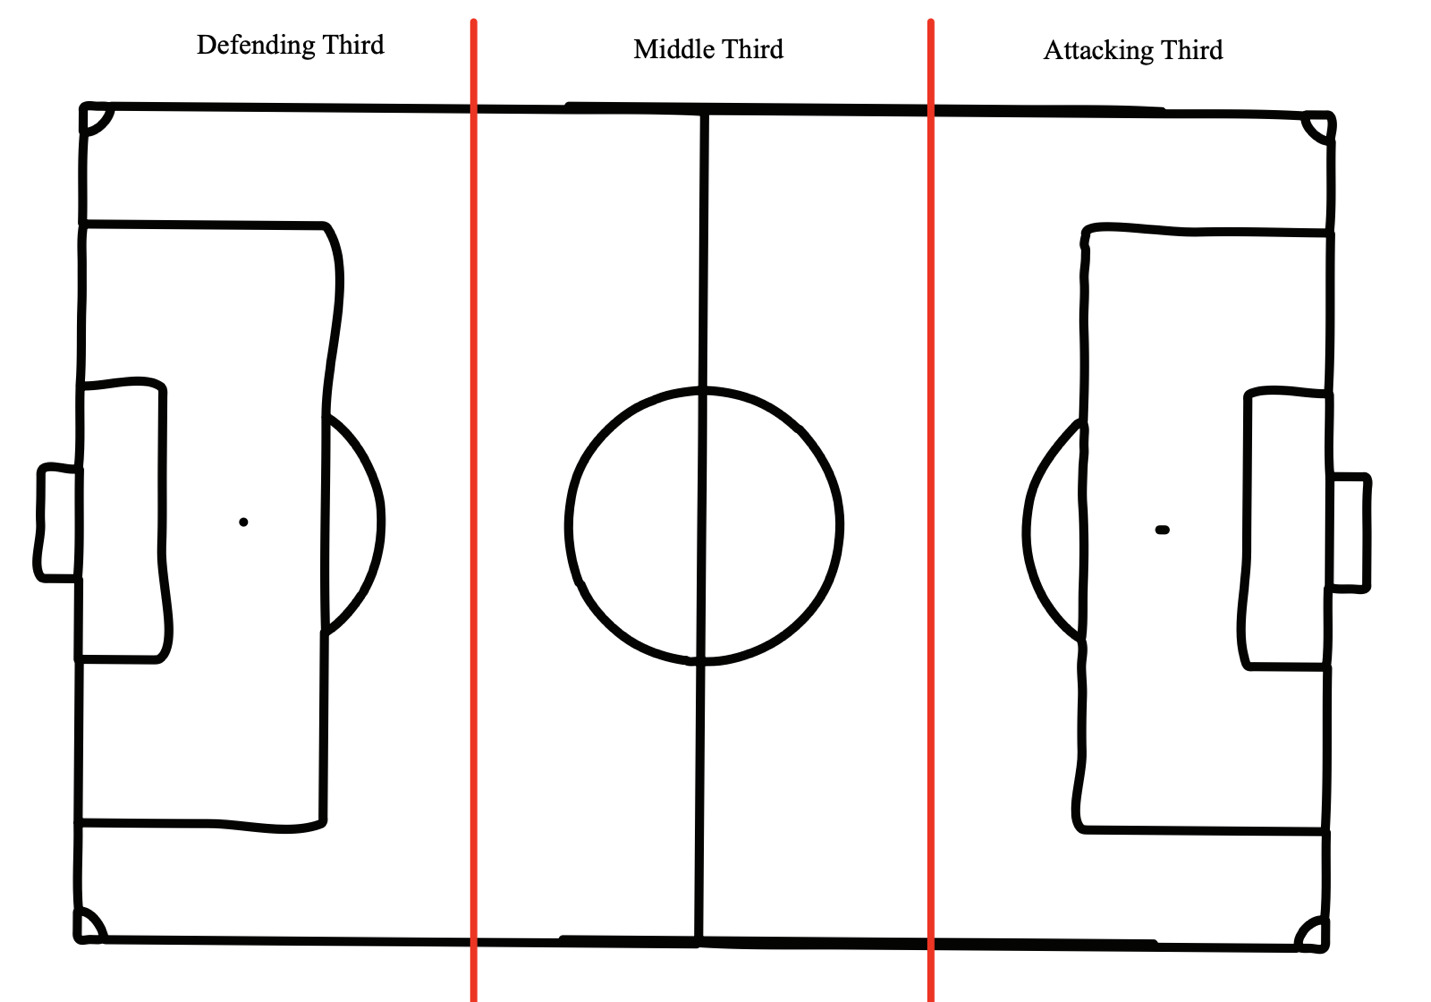
Lower extremity injuries are common in male professional soccer players, yet there are no known studies that examine how these injuries impact return to play in these athletes. A study examining injuries in Major League Soccer (MLS) players from 2014-2019, identified a total of 9,713 injuries, 7,679 of which occurred in the lower extremities (Forsythe et al. 2022). It was found that Midfielders and Forwards were more likely to suffer an injury compared to players in other positions (Forsythe et al. 2022). Another study found that player position impacts the occurrence of injury, and the specific type of injury suffered influences return to play (Hall et al. 2022). For example, players in attacking roles, such as Forwards or Wingers, predominantly occupy the attacking zone, known as the final third of the pitch closer to the opponent’s goalpost. Consequently, the average number of ball interactions, or ‘touches’, that these players have within the final third of the pitch per match is typically higher in comparison to players in midfield and defensive roles. Attacking players are primarily responsible for creating scoring opportunities by frequently attempting shots and engaging defender’s one-on-one. A study assessing the impact of high-intensity actions on injury incidence among 15 professional male soccer players found that these high-intensity actions, measured by metrics such as high-speed running and total distance covered, contribute to a higher injury risk for these players (Suarez-Arrones et al. 2020). Following an injury, attacking players may decrease their involvement in successful dribbles, one-on-one confrontations, and shots, which can adversely affect the team’s performance. This effect is often more significant than any similar performance statistic decline seen in defensive players (Verstappen et al. 2021).

Soccer requires a lot of physical contact between players, with emphasis on the lower part of the body, frequently resulting in lower extremity injuries. An evaluation of 24 professional male soccer players who underwent Achilles tendon repair found that 17 of 24 (70.8%) players were able to return to play (RTP) at a professional level after 10 months, however there was no data about how the injury affected each player’s performance (Trofa et al. 2018). Another study examined the impact of Achilles tendon repair on the performance of 22 MLS players (4 Forwards, 2 Midfield, 9 Defense, 2 Goalkeeper) (Sochacki et al. 2019). The authors found that although these players were able to RTP after injury, their careers were shortened by 2.5 ± 2.2 vs 4.5 ± 3.0 seasons (p=0.02) and they played fewer games per season than their matched controls (13.4 ± 8.4 vs 23.2 ± 6.5 games, p<0.001) post-operatively (Sochacki et al. 2019). Anterior Cruciate Ligament (ACL) injuries, one of the most common knee injuries in the MLS, are known to significantly affect an athlete’s career due to their extensive rehabilitation process. In a study that examined 40 MLS players who underwent ACL reconstruction between 2011-2014 (Arundale, Silvers-Granelli, and Snyder-Mackler 2018). The authors found that on average, the career length of a player who underwent surgery was 1.3 ± 1.3 years, compared to 2.5 ± 1.3 years for players who did not undergo ACL reconstruction (Arundale, Silvers-Granelli, and Snyder-Mackler 2018).

Injuries are a significant concern in professional soccer, affecting both player performance and career longevity. In another study, the medical staff of football clubs participating in the Union of European Football Association Elite Club reported a total of 22,942 injuries between the 2001 and 2017 seasons (Ekstrand et al. 2020). The authors identified the top 31 most common injury diagnoses, making up a total of 78.0% of all reported injuries, with thigh contusion (3.3%) being number one, followed closely by foot contusion (2.7%) (Ekstrand et al. 2020). Though there are numerous studies that have analyzed how injuries impact a player’s overall professional career, there is limited data on how an injury affects the different positions and their performance metrics. The purpose of this study was to analyze whether lower extremity injuries had an impact on the rate of return to play and performance in male major league soccer players.

Methods

Publicly available injury reports and player profiles were accessed to generate a list of male professional soccer players who played in either Major League Soccer (MLS) or the International Leagues during the 2018-2023 seasons. Data was collected using Transfermrkt and the MLS Player Availability Report from June 2023 to April 2024 and analyzed using Microsoft Excel and Julius, a statistical analysis program. Players who experienced a lower extremity injury during the 2018-2023 soccer seasons were included in the analysis. Specifically, this study focused on lower extremity injuries that resulted in 14 or more days of time loss from practices or matches.

Additionally, FBref, an online database that provides detailed analytics on professional male and female soccer players across various professional competitions, including major leagues and international tournaments, to obtain player statistics. The data collected included player position, role on the field, minutes played, and game participation, such as touches in the defensive and middle thirds, tackles, blocks, clearances, fouls, goals allowed, and expected goals allowed. We further quantified these statistics on a per-game basis to establish averages. We also recorded player demographics (e.g., age and position) and, when available, information on treatment received.

In this study, performance metrics were analyzed across three time periods following injury: short-term, medium-term, and long-term. Short-term refers to performance changes within the same year of the injury. Medium-term includes changes up to one-year post-injury, while long-term encompasses changes up to two years post-injury. The longer the period, the more comprehensive the data, though they are further removed from the initial injury.

Statistical analyses were conducted using Microsoft Excel and Julius, and performance metrics from before and after the injury were compared to measure the athlete’s performance when returning to play. Paired t-tests were used to assess the statistical significance of changes in various performance indicators such as minutes per game, passing accuracy, and defensive actions.

Results

From 2018 to 2023, 1,522 total injuries for men’s professional soccer seasons for both Major League Soccer and International Leagues were recorded, 838 (55.1%) of which were lower extremity injuries. These injuries were separated into different categories, including knee injury, hamstring injury, ankle injury, knee ligament injury, leg injury, calf injury, groin injury, thigh injury, foot injury, hip injury, meniscal injury, foot fracture, adductor problems, torn abductor, muscle, fibula fracture, ankle fracture, heel injury, tibia fracture, and patella injury. The knee was the most injured body part across all positions, consisting of 151 injuries (18.0%), followed by the hamstring (111 injuries; 13.2%). The Center Back was the most common position injured (166 injuries; 19.8%), followed by Center Midfield (162 injuries; 19.3%).

Player Demographics

The average age of the players was 25.5 years (range, 16 - 38 years). Goalkeepers had the highest average age at 26.9 years (range: 18-38 years), while Left/Right Backs had the lowest average age at 23.9 years (range: 16-34 years). The average ages for other positions were as follows: Central Back at 26.8 years (range: 17-38 years), Center Midfielder at 25.6 years (range: 17-36 years), Left Wing/Right Wing at 25.5 years (range: 17-35 years), Center Middle Defender at 24.9 years (range: 17-37 years), and Forwards at 24.9 years (range: 18-33 years).

Goalkeeper

Out of 838 injuries, goalkeepers sustained 53 (6.32%), with knee injuries being the most prevalent (16.98%). Short-term analysis revealed a general decline in performance metrics, with a significant decrease in fouls drawn per game. Medium-term metrics showed slight improvements, though not statistically significant. In the long term, goalkeepers showed statistically significant improvements in saves per 90 minutes and expected goals saved, despite facing more shots on target (Table 3).

Table 1.Player Position and Number of Lower Extremity Injuries
Position Count Percentage
Center back 166 19.8%
Center midfielder 162 19.3%
Forwards 152 18.1%
Left/Right back 125 14.9%
Left/Right wing 117 13.9%
Center middle defender 63 7.5%
Goalkeeper 53 6.3%
Total 838 100%
Table 2.Number of Lower Extremity Injuries by Body Part
Injury type Count Percentage
Knee injury 151 18.0%
Hamstring injury 111 13.2%
Knee ligament injury 89 10.6%
Ankle injury 87 10.4%
Leg injury 82 9.8%
Calf injury 60 7.2%
Groin injury 49 5.8%
Thigh injury 52 6.2%
Foot injury 42 5.0%
Hip injury 29 3.4%
Meniscal injury 20 2.4%
Foot fracture 17 2.0%
Torn abductor muscle 14 1.7%
Adductor problems 15 1.8%
Tibia fracture 7 0.8%
Heel injury 6 0.7%
Fibula fracture 3 0.4%
Ankle fracture 2 0.2%
Patella injury 2 0.2%
Total 838 100%
Table 3.Performance Metrics for Goalkeepers
Metric Pre-injury Post-injury Change P value Term
Minutes per game 87.6 78.7 ↓ 10.1% 0.1038 Short-term
Saves per game 2.9 2.7 ↓ 7.5% 0.564 Short-term
Shots on target against/game 4 3.9 ↓ 1.0% 0.9355 Short-term
Goals against/game 1.2 1.3 ↑ 3.8% 0.741 Short-term
Expected goals saved/game 1.1 1.1 ↑ 6.2% 0.6901 Short-term
Clean sheets/game 0.3 0.2 ↓ 18.2% 0.2658 Short-term
Sweeps/game 1 0.8 ↓ 22.4% 0.4468 Short-term
Fouls/game 0.1 0.1 ↓ 11.9% 0.8608 Short-term
Fouls drawn/game 0.3 0.1 ↓ 62.1% 0.0133 Short-term
Games started 25 26.6 ↑ 6.2% 0.726 Medium- term
Games played 25 26.6 ↑ 6.2% 0.726 Medium- term
Minutes played 2243.3 2383 ↑ 6.2% 0.7263 Medium- term
Expected goals saved/90 0.7 0.9 ↑ 29.6% 0.1362 Medium- term
Expected goals saved/game 0.7 0.9 ↑ 31.0% 0.1207 Medium- term
Clean sheets 6.6 6.7 ↑ 1.7% 0.9388 Medium- term
Clean sheets/90 0.19 0.19 ↓ 0.1% 0.9936 Medium- term
Clean sheets/game 0.19 0.19 ↑ 0.4% 0.974 Medium- term
Sweeps 13.1 17.9 ↑ 36.7% 0.265 Medium- term
Sweeps/90 0.4 0.5 ↑ 38.7% 0.1492 Medium- term
Sweeps/game 0.4 0.5 ↑ 38.4% 0.1522 Medium- term
Minutes per game 79.2 87.8 ↑ 10.8% 0.0553 Long- term
Saves per game 106.4 113.5 ↑ 6.7% 0.5813 Long- term
Saves per 90 minutes 2.4 3 ↑ 22.3% 0.0393 Long- term
Shots on target against/90 3.9 4 ↑ 2.6% 0.0071 Long- term
Goals against/90 1.3 1.4 ↑ 7.7% 0.0025 Long- term
Expected goals saved/90 1.1 1.2 ↑ 9.1% 0.0001 Long- term
Clean sheets/90 0.2 0.2 ↓ 6.3% 0.3076 Long- term

Center Middle Defender

Center Middle Defenders sustained 63 injuries (7.5%), with leg injuries being the most common (20.6%). Short-term performance metrics generally declined, with a significant decrease in fouls drawn. Medium-term analysis showed significant improvements in games started, pass percentage and tackles. In the long term, there were significant decreases in pass percentage and key passes, though minutes per game slightly increased without statistical significance (Table 4).

Table 4.Performance Metrics for Center Middle Defenders
Metric Pre-injury Post-injury Change P value Term
Minutes per game 87.6 78.7 ↓ 10.1% 0.1038 Short- term
Saves per game 2.9 2.7 ↓ 7.5% 0.564 Short- term
Shots on target against/game 4 3.9 ↓ 1.0% 0.9355 Short- term
Goals against/game 1.2 1.3 ↑ 3.8% 0.741 Short- term
Expected goals saved/game 1.1 1.1 ↑ 6.2% 0.6901 Short- term
Clean sheets/game 0.3 0.2 ↓ 18.2% 0.2658 Short- term
Sweeps/game 1 0.8 ↓ 22.4% 0.4468 Short- term
Fouls/game 0.1 0.1 ↓ 11.9% 0.8608 Short- term
Fouls drawn/game 0.3 0.1 ↓ 62.1% 0.0133 Short- term
Games started 32.7 34.4 ↑ 5.1% 0.556 Medium- term
Games played 32.7 34.4 ↑ 5.1% 0.556 Medium- term
Minutes played 2436.1 2440.8 ↑ 0.2% 0.985 Medium- term
Minutes per game 69.2 65.2 ↓ 5.7% 0.2468 Medium- term
Pass percentage 1523.2 2108.9 ↑ 38.5% 0.0272 Medium- term
Pass percentage per game 46.4 60.1 ↑ 29.5% 0.0242 Medium- term
Touches in def 3rd 237.3 316.3 ↑ 33.3% 0.0998 Medium- term
Touches in def 3rd/90 9.3 11.7 ↑ 25.5% 0.0876 Medium- term
Touches in mid 3rd 591.6 742.5 ↑ 25.5% 0.1748 Medium- term
Touches in mid 3rd/90 22.2 27.5 ↑ 23.9% 0.0842 Medium- term
Number of key passes 12.2 16.1 ↑ 31.9% 0.2057 Medium- term
Tackles 36.2 43.5 ↑ 20.2% 0.291 Medium- term
Tackles percentage per 90 23.4 33.1 ↑ 41.5% 0.0252 Medium- term
Clearances per 90 0.7 1 ↑ 35.1% 0.0507 Medium- term
Pass percentage per game 85.2 80.1 ↓ 6.0% 0.0001 Long- term
Touches in def 3rd/game 45.3 38.7 ↓ 14.6% 0.0036 Long- term
Key passes per game 2.1 1.5 ↓ 28.6% 0.00008 Long- term
Tackles percentage per game 75.4 68.2 ↓ 9.6% 0.001 Long- term
Minutes per game 78.5 80.2 ↑ 2.2% 0.094 Long- term
Interceptions per game 1.8 2 ↑ 11.1% 0.055 Long- term

Center Back

With 166 (19.8%) lower extremity injuries, Center Backs experienced significant short-term declines in performance, particularly in minutes per game, blocks, and clearances. There were medium-term improvements in tackles, touches, and defensive metrics. In the long term, there was a significant decrease in playing time, but defensive involvement improved, including touches in the defensive third and tackles (Table 5).

Table 5.Performance Metrics for Center Back
Metric Pre-injury Post-injury Change P value Term
Minutes per game 77.2 66.1 ↓ 14.4% <0.0001 Short-term
Touches in def 3rd/game 23 20.6 ↓ 10.4% 0.0813 Short-term
Touches in Mid 3rd/game 19 17.8 ↓ 6.6% 0.3286 Short-term
Tackles/game 0.9 0.9 ↓ 1.4% 0.8764 Short-term
Tackles pct/game 0.30 0.29 ↓ 3.8% 0.6745 Short-term
Blocks/game 0.9 0.7 ↓ 22.6% 0.0126 Short-term
Clearances/game 3 2.6 ↓ 14.2% 0.0328 Short-term
Fouls/game 0.9 0.7 ↓ 22.3% 0.0016 Short-term
Crosses/game 0.4 0.2 ↓ 38.9% 0.0515 Short-term
Successful dribbles/game 71.6 61.9 ↓ 13.5% 0.0563 Short-term
Progressive carries/game 0.7 0.5 ↓ 33.9% 0.0001 Short-term
Minutes per game 78 73.3 ↓ 6.0% 0.0015 Medium-term
Touches in def 3rd/game 14.7 17.8 ↑ 21.0% 0.0007 Medium-term
Touches in Mid 3rd/game 12.2 15.2 ↑ 24.3% 0.0001 Medium-term
Tackles/game 0.6 0.8 ↑ 27.2% 0.0005 Medium-term
Tackles pct/game 0.18 0.23 ↑ 27.7% 0.0004 Medium-term
Blocks/game 0.5 0.7 ↑ 25.1% 0.002 Medium-term
Clearances/game 2 2.3 ↑ 17.7% 0.0039 Medium-term
Fouls/game 0.6 0.7 ↑ 11.1% 0.0564 Medium-term
Crosses/game 0.2 0.1 ↓ 22.6% 0.0379 Medium-term
Successful dribbles/game 44.1 52.9 ↑ 20.0% 0.0027 Medium-term
Progressive carries/game 0.3 0.3 ↑ 13.6% 0.1047 Medium-term
Interceptions/game 1.1 1 ↓ 3.9% 0.4732 Medium-term
Minutes per game 79.1 74.1 ↓ 6.3% <0.001 Long-term
Touches in def 3rd/game 13.1 19.1 ↑ 45.8% <0.000001 Long-term
Tackles/game 0.6 0.8 ↑ 33.3% <0.000001 Long-term
Tackles pct/game 0.16 0.24 ↑ 52.1% <0.000001 Long-term
Interceptions/game 1.1 1.1 No change 0.932 Long-term

Center Midfielder

Center Midfielders sustained 162 injuries (19.3%), with knee injuries accounting for 17.9%. Short-term results showed declines in several metrics, notably a significant decrease in progressive carries. Medium-term improvements included pass percentage and key passes, with intensified midfield involvement. Long-term analysis revealed a slight decrease in minutes per game but significant increases in touches, pass percentage, and tackles, indicating improved performance post-injury (Table 6).

Table 6.Performance Metrics for Center Midfielder
Metric Pre-injury Post-injury Change P value Term
Minutes per game 77.2 66.1 ↓ 14.4% <0.0001 Short-term
Touches in def 3rd/game 23 20.6 ↓ 10.4% 0.0813 Short-term
Touches in mid 3rd/game 19 17.8 ↓ 6.6% 0.3286 Short-term
Tackles/game 0.9 0.9 ↓ 1.4% 0.8764 Short-term
Tackles pct/game 0.30 0.29 ↓ 3.8% 0.6745 Short-term
Blocks/game 0.9 0.7 ↓ 22.6% 0.0126 Short-term
Clearances/game 3 2.6 ↓ 14.2% 0.0328 Short-term
Fouls/game 0.9 0.7 ↓ 22.3% 0.0016 Short-term
Crosses/game 0.4 0.2 ↓ 38.9% 0.0515 Short-term
Successful dribbles/game 71.6 61.9 ↓ 13.5% 0.0563 Short-term
Progressive carries/game 0.7 0.5 ↓ 33.9% 0.0001 Short-term
Pass percentage/game 0.48 0.59 ↑ 23.6% <0.001 Medium-term
Key passes/game 0.7 0.8 ↑ 23.5% 0.004 Medium-term
Carries/game 16.9 19.8 ↑ 17.0% 0.005 Medium-term
Touches in mid 3rd/game 15.1 17.8 ↑ 17.5% 0.005 Medium-term
Touches in att 3rd/game 9 10.6 ↑ 17.5% 0.007 Medium-term
Tackle pct/game 0.16 0.19 ↑ 16.5% 0.008 Medium-term
Expected assists/game 0.066 0.08 ↑ 21.2% 0.009 Medium-term
Minutes/game 66.4 63.2 ↓ 4.8% 0.018 Medium-term
Tackles/game 0.9 1 ↑ 14.1% 0.028 Medium-term
Fouls drawn/game 1 1.1 ↑ 8.2% 0.059 Medium-term
Fouls committed/game 0.9 0.9 ↑ 5.9% 0.153 Medium-term
assists/game 0.1 0.1 ↓ 1.8% 0.74 Medium-term
Minutes per game 67.7 65.3 ↓ 3.5% 0.08 Long-term
Touches in mid 3rd/game 13.9 18.8 ↑ 35.3% <0.05 Long-term
Pass percentage/game 0.43 0.62 ↑ 43.1% <0.05 Long-term
Key passes/game 0.7 0.9 ↑ 28.6% <0.05 Long-term
Tackles/game 0.8 1 ↑ 25.0% <0.05 Long-term

Forward

Forwards experienced 152 injuries (18.1%), with the knee being the most injured body part (24.3%). In the short term, they had significant declines in minutes per game and offensive actions. Medium-term declines persisted, including in minutes per game and progressive carries. In the long term, although shots on target increased slightly, there was a significant decrease in goals per game. However, we noted improvements in dribbling and passing (Table 7).

Table 7.Performance Metrics for Forward
Metric Pre-injury Post-injury Change P value Term
Minutes per game 77.2 66.1 ↓ 14.4% <0.0001 Short-term
Touches in def 3rd/game 23 20.6 ↓ 10.4% 0.0813 Short-term
Touches in mid 3rd/game 19 17.8 ↓ 6.6% 0.3286 Short-term
Tackles/game 0.9 0.9 ↓ 1.4% 0.8764 Short-term
Tackles pct/game 0.30 0.29 ↓ 3.8% 0.6745 Short-term
Blocks/game 0.9 0.7 ↓ 22.6% 0.0126 Short-term
Clearances/game 3 2.6 ↓ 14.2% 0.0328 Short-term
Fouls/game 0.9 0.7 ↓ 22.3% 0.0016 Short-term
Crosses/game 0.4 0.2 ↓ 38.9% 0.0515 Short-term
Successful dribbles/game 71.6 61.9 ↓ 13.5% 0.0563 Short-term
Progressive carries/game 0.7 0.5 ↓ 33.9% 0.0001 Short-term
Minutes per game 77.2 66.1 ↓ 14.4% <0.0001 Medium-term
Touches in def 3rd/game 23 20.6 ↓ 10.4% 0.0813 Medium-term
Touches in mid 3rd/game 19 17.8 ↓ 6.6% 0.3286 Medium-term
Tackles/game 0.9 0.9 ↓ 1.4% 0.8764 Medium-term
Tackles pct/game 0.30 0.29 ↓ 3.8% 0.6745 Medium-term
Blocks/game 0.9 0.7 ↓ 22.6% 0.0126 Medium-term
Clearances/game 3 2.6 ↓ 14.2% 0.0328 Medium-term
Fouls/game 0.9 0.7 ↓ 22.3% 0.0016 Medium-term
Crosses/game 0.4 0.2 ↓ 38.9% 0.0515 Medium-term
Successful dribbles/game 71.6 61.9 ↓ 13.5% 0.0563 Medium-term
Progressive carries/game 0.7 0.5 ↓ 33.9% 0.0001 Medium-term
Minutes per game 54.9 54.5 ↓ 0.7% 0.8 Long-term
Shots on target/game 0.5 0.6 ↑ 12.2% 0.08 Long-term
Goals/game 0.3 0.2 ↓ 14.3% 0.03 Long-term
Assists/game 0.1 0.1 No change 0.4 Long-term
Successful dribbles/game 12.8 18.7 ↑ 46.1% <0.0500 Long-term
Completed passes/game 0.2 0.3 ↑ 34.8% <0.0500 Long-term

Left Wing / Right Wing

These positions accounted for 117 injuries (14.0%), with the knee being the most injured part (17.1%). Short-term analysis indicated declines in minutes per game and blocks, with a significant decrease in fouls. There were mixed results in the medium term, with increases in dribbles and crosses but declines in goals and assists. In the long term, playing time decreased while dribbling and crossing improved significantly (Table 8).

Table 8.Performance Metrics for Left Wing/Right Wing
Metric Pre-injury Post-injury Change P value Term
Minutes per game 77.2 66.1 ↓ 14.4% <0.0001 Short-term
Touches in def 3rd/game 23 20.6 ↓ 10.4% 0.0813 Short-term
Touches in mid 3rd/game 19 17.8 ↓ 6.6% 0.3286 Short-term
Tackles/game 0.9 0.9 ↓ 1.4% 0.8764 Short-term
Tackles pct/game 0.30 0.29 ↓ 3.8% 0.6745 Short-term
Blocks/game 0.9 0.7 ↓ 22.6% 0.0126 Short-term
Clearances/game 3 2.6 ↓ 14.2% 0.0328 Short-term
Fouls/game 0.9 0.7 ↓ 22.3% 0.0016 Short-term
Crosses/game 0.4 0.2 ↓ 38.9% 0.0515 Short-term
Successful dribbles/game 71.6 61.9 ↓ 13.5% 0.0563 Short-term
Progressive carries/game 0.7 0.5 ↓ 33.9% 0.0001 Short-term
Minutes per game 61.3 56.4 ↓ 8.0% 0.0063 Medium-term
Shots on target/90 0.6 0.7 ↑ 8.0% 0.114 Medium-term
Goals/90 8.5 6.6 ↓ 22.7% 0.0109 Medium-term
xG/90 0.2 0.2 ↑ 17.6% 0.0145 Medium-term
Crosses into penalty area/90 0.2 0.2 ↑ 21.4% 0.0267 Medium-term
Progressive carries 71.8 70.9 ↓ 1.3% 0.8998 Medium-term
Successful dribbles/90 69.9 81.8 ↑ 17.0% 0.0052 Medium-term
Assists/90 0.2 0.2 ↓ 7.5% 0.3592 Medium-term
Successful dribbles/game 47.4 51.6 ↑ 8.8% 0.1928 Medium-term
Assists/game 0.1 0.1 ↓ 15.2% 0.0455 Medium-term
Goals/game 0.2 0.2 ↓ 10.2% 0.1655 Medium-term
Games started 42.6 39.7 ↓ 6.8% 0.2238 Medium-term
Games played 42.6 39.7 ↓ 6.8% 0.2238 Medium-term
Minutes 2830.4 2369.7 ↓ 16.3% 0.0097 Medium-term
xG/game 0.1 0.1 ↑ 8.2% 0.2364 Medium-term
Shots on target/game 23 19.6 ↓ 14.6% 0.0878 Medium-term
Progressive carries/game 1.5 1.6 ↑ 6.4% 0.3547 Medium-term
Crosses into penalty area/game 0.1 0.2 ↑ 12.4% 0.2053 Medium-term
Progressive carries/90 2.3 2.6 ↑ 13.7% 0.0296 Medium-term
Minutes per game 61.9 57.5 ↓ 7.1% 0.005 Long-term
Shots on target/game 0.47 0.47 No change NS Long-term
Goals/game 0.18 0.17 ↓ 6.8% NS Long-term
Assists/game 0.12 0.12 ↓ 5.6% NS Long-term
Successful dribbles/game 45.7 54.7 ↑ 19.7% 0.006 Long-term
Crosses into penalty area/game 0.14 0.17 ↑ 26.7% 0.007 Long-term

Left Back/ Right Back

Left and Right Backs sustained 125 injuries (14.9%), with the knee being the most affected (20.0%). Short-term metrics showed decreases in minutes per game, blocks, and progressive carries. In the medium term, tackles and touches increased, indicating greater involvement in defensive and midfield actions. Long-term analysis revealed reduced playing time but significant improvements in passing, tackles, and progressive carries (Table 9).

Table 9.Performance Metrics for Left Back/Right Back
Metric Pre-injury Post-injury Change P value Term
Minutes per game 75.1 65.4 ↓ 13.0% <0.0001 Short-term
Touches in def 3rd/game 20.1 18.6 ↓ 7.7% 0.0456 Short-term
Touches in mid 3rd/game 18.2 16.8 ↓ 7.7% 0.0678 Short-term
Tackles/game 1.1 1 ↓ 9.9% 0.1234 Short-term
Tackles pct/game 0.32 0.31 ↓ 4.8% 0.2345 Short-term
Blocks/game 1.2 1 ↓ 18.0% 0.0345 Short-term
Clearances/game 2.3 2.1 ↓ 9.5% 0.0456 Short-term
Fouls/game 1 0.9 ↓ 11.3% 0.0567 Short-term
Crosses/game 0.5 0.3 ↓ 24.3% 0.0678 Short-term
Successful dribbles/game 70.1 60.6 ↓ 13.6% 0.0789 Short-term
Progressive carries/game 0.8 0.7 ↓ 14.0% 0.089 Short-term
Tackles pct/game 0.21 0.26 ↑ 26.3% 0.0013 Medium-term
Clearances/game 0.9 1.2 ↑ 30.1% 0.0013 Medium-term
Touches in mid 3rd/90 14.5 20.3 ↑ 40.0% <0.0001 Medium-term
Touches in def 3rd/90 9.7 12.9 ↑ 33.0% <0.0001 Medium-term
Successful dribbles/90 48.4 64.7 ↑ 33.7% 0.0002 Medium-term
Pass pct/game 0.40 0.53 ↑ 32.6% <0.0001 Medium-term
Key passes/90 0.5 0.6 ↑ 25.6% 0.0061 Medium-term
Tackles/game 0.9 1.1 ↑ 24.1% 0.0076 Medium-term
Progressive carries/game 1 1.1 ↑ 20.1% 0.0411 Medium-term
Blocks/game 0.5 0.6 ↑ 28.7% 0.0014 Medium-term
Blocks/90 0.6 0.8 ↑ 34.9% 0.0001 Medium-term
Minutes per game 72.2 66.2 ↓ 8.3% 0.002 Long-term
Pass pct/game 0.36 0.55 ↑ 56.1% <0.001 Long-term
Touches in def 3rd/game 6.9 10 ↑ 45.9% <0.001 Long-term
Touches in mid 3rd/game 10.4 15.2 ↑ 46.0% <0.001 Long-term
Key passes/game 0.4 0.5 ↑ 37.4% <0.001 Long-term
Tackles/game 0.8 1.2 ↑ 44.1% <0.001 Long-term
Successful dribbles/game 35.2 49.8 ↑ 41.5% <0.001 Long-term
Progressive carries/game 0.9 1.2 ↑ 33.5% 0.001 Long-term

Discussion

The knee was the most frequently injured body part during the 2018-2023 professional and international soccer seasons, particularly affecting performance across various positions. Center Backs experienced significant changes, including declines in blocks and clearances post-injury. Forwards saw a notable reduction in offensive performance, with a decrease in goals per game. Center Midfielders demonstrated relatively stable performance post-injury, with improvements in pass percentage and tackles, despite some declines in other areas. These position-specific changes highlight the diverse impact of lower extremity injuries on soccer performance metrics, underlining the need for tailored recovery and injury prevention strategies.

In 2013, Hägglund et al. examined lower extremity injuries in players from 26 soccer clubs in Europe between 2001 and 2010 (Hägglund, Waldén, and Ekstrand 2013). This study focused on the major muscle groups of the lower extremity (quadriceps, hamstrings, adductors, gastrocnemius), and the authors found that these muscle groups comprise roughly 90.0% of all lower extremity injuries in professional soccer players in Europe (Hägglund, Waldén, and Ekstrand 2013). Forsythe et al. analyzed injuries in MLS players from 2014-2019 and found that hamstring injuries were the most prevalent, and the knee was the second most commonly injured joint in the lower extremity (Forsythe et al. 2022). These results align closely with the findings from the present study, with the knee being the most commonly injured joint and the hamstring being a close second. Furthermore, Forsythe et al. examined risk factors for injury in male Major League Soccer players and identified that sustaining a previous identical injury or an injury to the lower extremity was correlated with increased risk of injury (Forsythe et al. 2022). This finding is supported by the results from a 2018 study by Arundale et al. that examined reinjury rates in male Major League Soccer players. The authors found that among soccer players who underwent ACL reconstruction, there was a reinjury rate of 28.0% (Arundale, Silvers-Granelli, and Snyder-Mackler 2018). This highlights the need for more research in not just injury prevention but targeted rehabilitation efforts to return a soccer player to his original performance level.

Clinical Implications

The consensus definition of RTP describes the point at which an athlete has achieved criteria-based medical clearance and is prepared for full participation in training or competition, with the team physician assuming primary responsibility for athlete safety and leading a shared decision-making process that includes the athlete, sports physician, physiotherapist, fitness trainer, and coach (van der Horst et al. 2017; Herring et al. 2024). In this context, the impact of lower-extremity injuries on performance is best assessed through objective metrics, which are more sensitive than patient-reported outcomes for evaluating post-injury function and treatment efficacy, as patient-reported tools often fail to detect clinically relevant performance deficits (Zuke, Agarwalla, Go, et al. 2018). Accordingly, pre-season and in-season screenings using isokinetic strength testing, the Lower Extremity Functional Test (LEFT), and Y-balance assessments are used to identify at-risk players and detect functional asymmetries (D’Onofrio et al. 2025; Liporaci et al. 2019; Mohammadi et al. 2024; Jiménez-Rubio et al. 2023). Evidence further supports the use of multicomponent, position-tailored prevention and rehabilitation programs that integrate strength, neuromuscular control, agility, and movement quality to reduce injury incidence and burden (Gronwald, Klein, Hoenig, et al. 2022; Aiello et al. 2023; Shalaj et al. 2020). For example, interventions emphasizing eccentric hamstring strength and lumbo-pelvic stability are particularly beneficial for positions with high sprinting and kicking demands, however, the predictive value of the screening tests remains limited, highlighting the need for position-specific protocols to optimize outcomes (Mohammadi et al. 2024; Aiello et al. 2023; Vereijken et al. 2022). Clinical decision-making should prioritize sport-specific, performance-based outcomes rather than patient-reported measures, which lack sensitivity in detecting residual deficits in professional soccer players. The absence of standardized, validated position-specific performance benchmarks underscores the necessity for further research to establish criteria for safe and effective RTP across positions and injury types (Zuke, Agarwalla, Go, et al. 2018; Diniz, Abreu, Lacerda, et al. 2022).

Limitations

There are several limitations to this study. First, there is no standardized database produced by Major League Soccer that compiles injury data and performance metrics. The most reliable sources for this information are websites that are used by coaches and team managers for team planning and scenario assessment, particularly integrating epidemiological data and predictive models for return-to-play timelines. There are limitations in data accuracy in data accuracy and not reliable for the use of direct clinical decision making, but as support for it. Caution is recommended in interpreting the results due to this. There were a few instances where there were discrepancies in the injury timeline between the websites used.

Additionally, the available injury data did not provide full details on the type of injury sustained. For example, as opposed to stating that a player had a tear of the Anterior Talofibular Ligament, the report only noted it as an “Ankle Injury”. More detailed information regarding the type of injury could have allowed our team to more accurately analyze the injuries impacting professional soccer players. Furthermore, the sources used did not identify the specific treatments or rehabilitation protocols used for these injuries. Understanding what types of interventions, such as physical therapy, surgical procedures, or strength training, medical staff used could have provided more insight into the factors influencing players’ performance metrics post-injury.

Conclusion

The knee was the most injured body part during the 2018-2023 professional and international soccer seasons. Among the positions, Center Backs experienced both declines and improvements in defensive performance metrics post-injury, with significant changes observed across short-, medium-, and long-term periods. Forwards demonstrated a decrease in goals per game and other offensive metrics following injury. In contrast, Center Midfielders experienced a relatively stable level of performance post-injury, showing improvements in certain metrics despite some declines. The findings of this study can guide sports medicine professionals in enhancing patient recovery, prolonging players’ careers, and developing targeted injury prevention strategies by understanding the position-specific impacts of lower extremity injuries on soccer performance.

A diagram of a football field AI-generated content may be incorrect.
Figure 1.Location of Defending, Middle, and Attacking Third

Acknowledgements

We would like to thank Howdy Coder LLC for your assistance with the statistical analysis.

Submitted: April 20, 2025 EDT

Accepted: October 25, 2025 EDT

References

Aiello, F., F. M. Impellizzeri, S. J. Brown, A. Serner, and A. McCall. 2023. “Injury-Inciting Activities in Male and Female Football Players: A Systematic Review.” Sports Med 53 (1): 151–76. https:/​/​doi.org/​10.1007/​s40279-022-01753-5.
Google Scholar
Arundale, A. J. H., H. J. Silvers-Granelli, and L. Snyder-Mackler. 2018. “Carer Length and Injury Incidence after Anterior Cruciate Ligament Reconstruction in Major League Soccer Players.” Orthop J Sports Med 6 (1). https:/​/​doi.org/​10.1177/​2325967117750825.
Google ScholarPubMed CentralPubMed
Diniz, P., M. Abreu, D. Lacerda, et al. 2022. “Pre-Injury Performance Is Most Important for Predicting the Level of Match Participation after Achilles Tendon Ruptures in Elite Soccer Players: A Study Using a Machine Learning Classifier.” Knee Surg Sports Traumatol Arthrosc 30 (12): 4225–37. https:/​/​doi.org/​10.1007/​s00167-022-07082-4.
Google Scholar
D’Onofrio, R., P. Perna, D. Pompa, C. Civitillo, I. Sannicandro, and V. Manzi. 2025. “Asymmetry, Lumbo-Pelvic Hip Complex and Injury in European Soccer Players.” J Sports Med Phys Fitness, July. https:/​/​doi.org/​10.23736/​S0022-4707.25.16845-X.
Google Scholar
Ekstrand, J., W. Krutsch, A. Spreco, W. van Zoest, C. Roberts, T. Meyer, and H. Bengtsson. 2020. “Time before Return to Play for the Most Common Injuries in Professional Football: A 16-Year Follow-up of the UEFA Elite Club Injury Study.” British Journal of Sports Medicine 54 (7): 421–26. https:/​/​doi.org/​10.1136/​bjsports-2019-100666.
Google Scholar
Forsythe, B., D. M. Knapik, M. D. Crawford, C. Diaz, D. Hardin, J. Gallucci, H. J. Silvers-Granelli, et al. 2022. “Incidence of Injury for Professional Soccer Players in the United States: A 6-Year Prospective Study of Major League Soccer.” Orthop J Sports Med 10 (3). https:/​/​doi.org/​10.1177/​23259671211055136.
Google ScholarPubMed CentralPubMed
Gronwald, T., C. Klein, T. Hoenig, et al. 2022. “Hamstring Injury Patterns in Professional Male Football (Soccer): A Systematic Video Analysis of 52 Cases.” Br J Sports Med 56 (3): 165–71. https:/​/​doi.org/​10.1136/​bjsports-2021-104769.
Google Scholar
Hägglund, M., M. Waldén, and J. Ekstrand. 2013. “Risk Factors for Lower Extremity Muscle Injury in Professional Soccer: The UEFA Injury Study.” Am J Sports Med 41 (2): 327–35.
Google Scholar
Hall, E. C., J. Larruskain, S. M. Gil, J. A. Lekue, P. Baumert, D. Edgardo Rienzi, S. Moreno, et al. 2022. “Playing Position Is Associated with Injury Incidence Rate in Male Academy Soccer Players.” J Athl Train 57 (7): 696–703.
Google Scholar
Herring, S. A., M. Putukian, W. B. Kibler, L. LeClere, L. Boyajian-O’Neill, M. A. Day, R. R. Franks, et al. 2024. “Team Physician Consensus Statement: Return to Sport/Return to Play and the Team Physician: A Team Physician Consensus Statement—2023 Update.” Med Sci Sports Exerc 56 (5): 767–75. https:/​/​doi.org/​10.1249/​MSS.0000000000003371.
Google Scholar
Horst, N. van der, F. Backx, E. A. Goedhart, B. M. Huisstede, and HIPS-Delphi Group. 2017. “Return to Play after Hamstring Injuries in Football (Soccer): A Worldwide Delphi Procedure Regarding Definition, Medical Criteria and Decision-Making.” Br J Sports Med 51 (22): 1583–91. https:/​/​doi.org/​10.1136/​bjsports-2016-097206.
Google Scholar
Jiménez-Rubio, S., J. Raya-González, D. Lobo-Triviño, and T. García-Calvo. 2023. “The Impact of a Multicomponent Training Program on Physical Fitness and Joint Injuries in Spanish Male Professional Soccer Players.” J Sports Sci 41 (21): 1934–43. https:/​/​doi.org/​10.1080/​02640414.2024.2307780.
Google Scholar
Liporaci, R. F., M. Saad, D. B. Grossi, and M. Riberto. 2019. “Clinical Features and Isokinetic Parameters in Assessing Injury Risk in Elite Football Players.” Int J Sports Med 40 (14): 903–8. https:/​/​doi.org/​10.1055/​a-1014-2911.
Google Scholar
Mohammadi, H., R. Ghaffari, A. Kazemi, D.G. Behm, and M. Hosseinzadeh. 2024. “Evaluation of the Lower Extremity Functional Test to Predict Lower Limb Injuries in Professional Male Footballers.” Sci Rep 14 (1): 2596. https:/​/​doi.org/​10.1038/​s41598-024-53223-9.
Google Scholar
Shalaj, I., M. Gjaka, N. Bachl, B. Wessner, H. Tschan, and F. Tishukaj. 2020. “Potential Prognostic Factors for Hamstring Muscle Injury in Elite Male Soccer Players: A Prospective Study.” PLoS One 15 (11): e0241127. https:/​/​doi.org/​10.1371/​journal.pone.0241127.
Google Scholar
Sochacki, K. R., R. A. Jack II, T. Hirase, P. C. McCulloch, D. M. Lintner, K. E. Varner, P. E. Cosculluela, and J. D. Harris. 2019. “There Is a High Return to Sport Rate but with Reduced Career Lengths after Achilles Tendon Repair in Major League Soccer Players.” JISAKOS 4 (1). https:/​/​doi.org/​10.1136/​jisakos-2018-000246.
Google Scholar
Suarez-Arrones, L., B. De Alba, M. Röll, I. Torreno, S. Strütt, K. Freyler, and R. Ritzmann. 2020. “Player Monitoring in Professional Soccer: Spikes in Acute:Chronic Workload Are Dissociated From Injury Occurrence.” Frontiers in Sports and Active Living 2:75–75. https:/​/​doi.org/​10.3389/​fspor.2020.00075.
Google Scholar
Trofa, D. P., P. C. Noback, J. M. Caldwell, J. C. Miller, J. K. Greisberg, C. S. Ahmad, and J. T. Vosseller. 2018. “Professional Soccer Players’ Return to Play and Performance after Operative Repair of Achilles Tendon Rupture.” Orthop J Sports Med 6 (11). https:/​/​doi.org/​10.1177/​2325967118810772.
Google ScholarPubMed CentralPubMed
Vereijken, A., I. Aerts, E. VAN Trijffel, B. Tassignon, J. Verschueren, and R. Meeusen. 2022. “Pre- and Postmatch Hop Test Outcomes in Soccer Players Returning to Performance after Lower Extremity Injury.” J Sports Med Phys Fitness 62 (7): 953–60. https:/​/​doi.org/​10.23736/​S0022-4707.21.12576-9.
Google Scholar
Verstappen, S., R. M. van Rijn, R. Cost, and J. H. Stubbe. 2021. “The Association Between Training Load and Injury Risk in Elite Youth Soccer Players: A Systematic Review and Best Evidence Synthesis.” Sports Medicine - Open 7 (1). https:/​/​doi.org/​10.1186/​s40798-020-00296-1.
Google Scholar
Zuke, W. A., A. Agarwalla, B. Go, et al. 2018. “The Lack of Standardized Outcome Measures Following Lower Extremity Injury in Elite Soccer: A Systematic Review.” Knee Surg Sports Traumatol Arthrosc 26 (10): 3109–17. https:/​/​doi.org/​10.1007/​s00167-018-5032-1.
Google Scholar

Attachments

Powered by Scholastica, the modern academic journal management system