
Introduction
The economic burden of cancer, as reported by the American Cancer Society, is approximately $12.6 billion, with metastatic bone disease (MBD) contributing significantly to this cost. Patients with MBD incur higher medical expenses compared to those without metastatic disease, with an incremental cost of $44,442 per patient. MBD is prevalent in 60-84% of patients with cancer, exacerbating the overall economic burden on healthcare systems (Schulman and Kohles 2007). Hospitalization costs escalate upon diagnosis of MBD, not only due to treatment associated with this disease but also due to skeletal-related events (SREs) including pathologic fractures, spinal cord compressions, external beam irradiation, and bone surgeries.
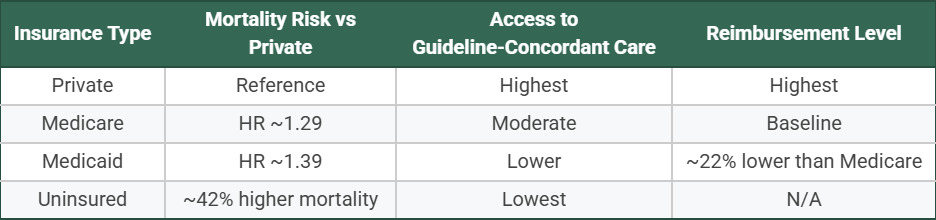
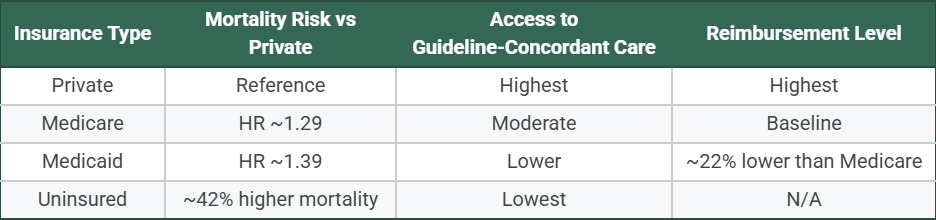
The financial burden of MBD varies substantially by insurance type, with significant disparities in both access to care and outcomes. Patients with Medicaid or no insurance face higher mortality rates and later-stage diagnoses compared to those with private insurance (Tian et al. 2025; Islami et al. 2023). Medicaid-insured patients have 39% higher mortality risk, while uninsured patients face 42% higher mortality compared to privately insured patients across cancer types (Tian et al. 2025). These disparities persist even after controlling for stage at diagnosis, suggesting differential access to guideline-concordant treatment (Zhao et al. 2022). Medicare beneficiaries also experience worse outcomes than privately insured patients, with hazard ratios for mortality ranging from 1.29 for Medicare to 1.39 for Medicaid compared to private insurance (Figure 1) (Tian et al. 2025). Medicaid reimbursement for orthopedic oncology procedures is 22% lower than Medicare nationally, with substantial state-to-state variation ranging from 37% to 131% of Medicare rates (Figure 1) (Henderson et al. 2025).
Geographic disparities compound these insurance-related inequities. Cancer mortality rates are 21% higher in nonmetropolitan areas compared to large metropolitan areas, with the greatest differences observed for lung (45%) and cervical (36%) cancers (Islami et al. 2023). (Islami et al. 2025) The highest cancer mortality rates are concentrated in the South and East North-Central Midwest regions (Islami et al. 2025). Rural patients face limited access to oncology specialists and orthopedic oncology services, with rural hospital closures particularly common in states that have not expanded Medicaid (Islami et al. 2023). These geographic barriers are especially relevant for MBD patients who require specialized orthopedic oncology care, as 39% of centers lack a designated MBD lead (Archer et al. 2023).
Direct costs associated with orthopedic tumor surgeries include inpatient and outpatient care, medication, laboratory testing, physical therapy, and long-term follow-up visits. Indirect costs, although less easily quantified, contribute significantly to the overall financial burden. These include lost wages due to decreased productivity or inability to work, and the need for disability benefits. Additionally, the cost of caregivers often goes unrecognized in these calculations, specifically family caregivers who are often unpaid, further increasing the societal impact (Tian et al. 2025).
Medicare reimbursement for orthopedic oncology procedures has fluctuated over the years. From 2000 to 2020, there has been a 13.6% overall decline in Medicare payments for procedures related to metastatic disease management. However, despite an overall decline in Medicare payments, spine and pelvic orthopedic oncology procedures had a 7.6% increase in payments while limb salvage procedures saw a 14.6% increase. These trends reflect the evolving financial landscape in orthopedic oncology and highlight the challenges faced by healthcare providers in managing the costs associated with these procedures. Despite the increased payments for certain procedures, the overall decline in reimbursement for managing complications and metastatic disease underscores the need for efficient cost management strategies (Islami et al. 2023).
Telemedicine has emerged as a cost-effective alternative for orthopedic oncology patients, significantly reducing travel and consultation costs while maintaining clinical safety. In a study of 308 patients with 528 telemedicine visits, potential cost savings reached up to $475 per visit, with no missed complications; only 4.5% required unexpected in-person evaluation (Arpey et al. 2025). An academic orthopedic oncology practice similarly reported >90% patient satisfaction, with telemedicine rated equal or superior to in-office visits for convenience, time, privacy, and overall quality, and comparable reimbursement (Lawrenz et al. 2021). For sarcoma patients, who often travel long distances, telemedicine has demonstrated high value. Patient satisfaction with telemedicine in sarcoma care averaged 9.4 out of 10, comparable to in-person appointments (9.5/10), with 80% of patients desiring some telemedicine as part of their future care (Smrke et al. 2020; McCabe et al. 2021). The application of telemedicine to sarcoma management has yielded improved clinical and psychological outcomes, with efficacy demonstrated across a wide spectrum of applications from physical therapy consultations to virtual symptom management (Tsagkaris et al. 2023).
However, recent policy changes threaten to limit telehealth access, particularly for Medicare beneficiaries. The Centers for Medicare and Medicaid Services (CMS) temporarily expanded telehealth coverage, allowing beneficiaries to receive services at home and reimbursing audio-only visits (Doshi et al. 2024; Brotman and Kotloff 2021). These waivers were initially set to expire in December 2024 but have been extended through 2026 pending Congressional approval (Doshi et al. 2024). Prior to the pandemic, Medicare telehealth was largely restricted to rural areas and required patients to travel to designated healthcare facilities (Brotman and Kotloff 2021). The potential return to these restrictive policies could disproportionately affect cancer patients with complex needs who have come to rely on telehealth services (Doshi et al. 2024). (Lopez 2024)
In addition, disparities in telehealth utilization by insurance type have already emerged. Studies show that Medicare enrollees had fewer telehealth visits compared to commercially insured patients, while Medicaid enrollees had more telehealth visits but faced greater barriers to video-based care (Ramsey et al. 2025; Cousins et al. 2022). Patients with Medicaid were 53.6% less likely to complete video visits compared to those with private insurance, often defaulting to audio-only visits (Cousins et al. 2022). Additionally, older patients, racial minorities, those in areas with limited technology access (high Digital Divide Index), and those with Medicare or Medicaid insurance were significantly less likely to use video telehealth (Cousins et al. 2022; Lama et al. 2022). Without permanent policy solutions ensuring equitable telehealth access across insurance types and geographic regions, these disparities may widen (Holliday et al. 2025).
Socioeconomic and geographic factors play a critical role in the survival and treatment costs of patients with orthopedic tumors. Patients from lower socioeconomic backgrounds, lack of insurance or residing in rural or underserved areas face higher mortality rates and financial barriers to accessing treatment (Zhao et al. 2022). For instance, patients with Ewing sarcoma and osteosarcoma from lower socioeconomic backgrounds, or without insurance, experience significantly higher mortality rates and treatment costs (Zhao et al. 2022). Addressing these disparities is crucial for improving survival rates and reducing long-term healthcare costs. Targeted interventions to improve access to care and support for lower socioeconomic patients can significantly enhance outcomes and reduce the overall financial burden on healthcare systems.
Reducing the incidence of MBD and SREs can significantly alleviate the financial and logistical burden on healthcare providers. Prevention, early detection, and advancements in treatment modalities, can contribute to lower healthcare costs and improved patient outcomes (Pockett et al. 2010). Moreover, the adoption of bundled payment models and value-based care approaches can incentivize healthcare providers to deliver high-quality care while controlling costs (Aljuboori et al. 2020). This manuscript is a narrative review synthesizing existing literature on the economic burden, value, and cost-effectiveness of care in orthopedic oncology.
Value
In healthcare economics, value is a function of quality divided by the cost, reflecting the outcomes achieved and the resources invested. Enhancing patient outcomes (quality) or lowering costs both improve value. To illustrate this concept, a value equation is represented below:
\[\text{Value} = \frac{\text{Quality}}{\text{Cost}}\]
To evaluate value, researchers commonly use three approaches—cost-benefit analysis (CBA), cost-effectiveness analysis (CEA), and cost-utility analysis (CUA)—each offering a different way to assess the efficiency and impact of care delivery. A CBA converts the health effects of an intervention into monetary terms, enabling a direct comparison between its benefits and expenses (Robinson 1993a). While straightforward, this approach has notable limitations, assigning a dollar value to health outcomes can oversimplify complex patient experiences and raise ethical questions about valuing human life in purely financial terms. This presents a challenge as these outcomes can only be truly determined by the patient, which restricts the prevalence of CBAs in medical economic assessments (Moayyedi and Mason 2004).
Cost-effectiveness analysis (CEA) expresses quality in “natural units” rather than in monetary terms (Robinson 1993b). These units may include patient-reported outcomes, pain levels, or the number of deaths prevented, but they can be difficult to compare across different specialties. Prior work by Per-Ulf Tunn et al describes three different systems which attempt to quantify and qualify quality of life for patients with orthopedic tumors, including the Musculoskeletal Tumour Society Score (MSTS), the Toronto Extremity Salvage Score (TESS), and the Reintegration to Normal Living index (RNL) (Tunn et al. 2007). Despite circumventing the ethical issues associated with CBAs by avoiding monetary valuations, CEAs encounter significant challenges in generalizability. CEAs present difficulties with comparing various disease processes as certain conditions lack defined outcomes (Angevine and Berven 2014). Accounting for this difference, the value equation for CEAs can be defined as:
\[\text{Value}_{CEA} = \frac{Quality}{Costs} = \frac{Disease\ -\ Specific\ Outcome}{Costs}\]
CUAs overcome some challenges of CEAs by standardizing interventions by expressing quality in terms of utility, or quality-adjusted life-years (QALYs). This standardized approach enables comparisons across various health conditions and interventions by providing a common metric (Rai and Goyal 2018). CUAs are particularly valued for their ability to facilitate comparisons between diverse interventions. However, there is continued debate about using QALYs for older populations, as the potential benefits may be lower compared to younger groups due to variation in life expectancy (Huter et al. 2016). Despite this, the United States Panel on Cost-Effectiveness in Health and Medicine recommended the use of CUAs for health economic studies, which has resulted in CUAs becoming one of the most widely used economic analyses (Weinstein et al. 1996). To calculate CUAs and describe its operational definition as a function of QALY and cost, the following equation can be used:
\[\text{Value}_{CUA} = \frac{Value}{Costs} = \frac{Utility\ \times\ \text{Time}}{Costs}=\frac{\text{QALY}}{\text{Cost}}\]
In conclusion, the three approaches—CBA, CEA, and CUA—each contribute unique perspectives on evaluating the value of healthcare interventions. CBA frames outcomes in monetary terms but is limited by ethical concerns and practical challenges. CEA, by focusing on health outcomes measured in natural units, avoids these ethical issues but struggles with comparability across different conditions. CUA, through its standardized QALY metric, allows for broader and more consistent comparisons between treatments and conditions, which is why it is often the preferred method in health economic evaluations. In orthopedic oncology, value is ultimately defined by the balance between oncologic control, functional preservation, complication risk, and long-term survivorship, making value-based assessment essential when comparing surgical and adjuvant treatment strategies.
Quality
Given the strength of CUAs, its usage requires evaluation of quality in the context of utility, a preference-based metric. Utility is quantified on a scale from 0 to 1, where ‘0’ represents death and ‘1’ denotes perfect health (Garza and Wyrwich 2003). The primary modalities in determining utility scores are the Standard Gamble Method and Time Trade-off (Arnold et al. 2009).
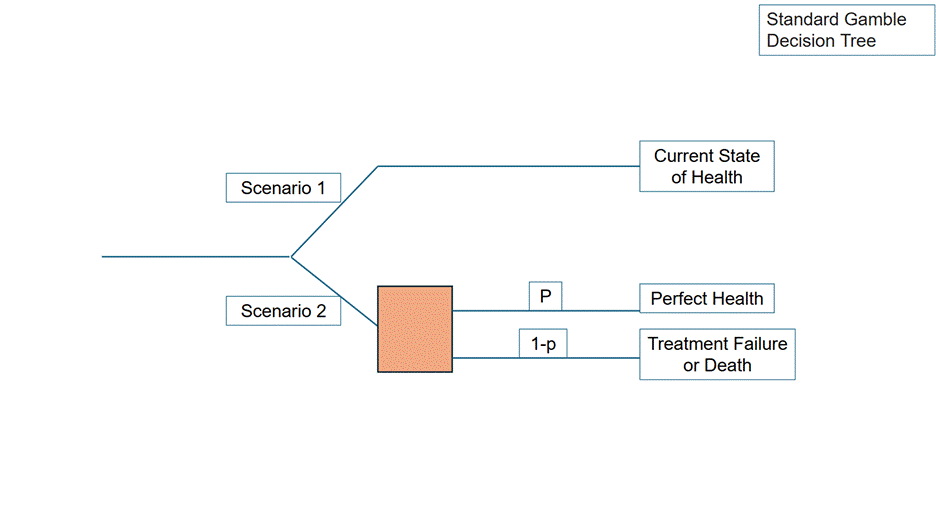
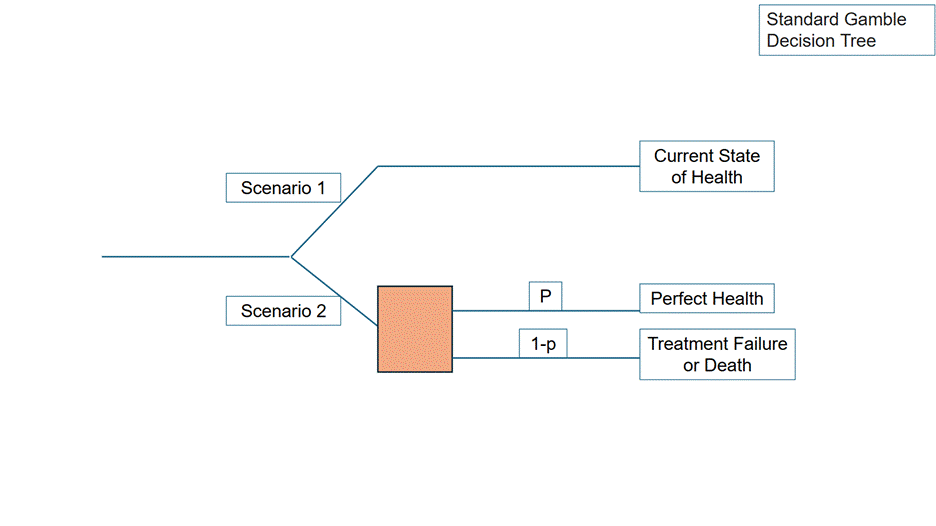
In the Standard Gamble Method, patients are asked to choose between remaining in their current health state or undergoing a hypothetical intervention with two possible outcomes: perfect health (with probability p) or death (with probability 1–p). The probability of success (p) is adjusted until the patient is indifferent between the two options. This threshold probability reflects the utility of their current state of health (Torrance et al. 1972). For instance, consider a patient deciding whether to undergo surgery for osteosarcoma. If the surgery has a 75% success rate and the patient is indifferent at that threshold, then p = 0.75 and 1–p = 0.25. The utility of the surgery would be calculated as U = (0.75 × 1) + (0.25 × 0) = 0.75. This value quantifies the patient’s perceived quality of life associated with the surgery (Figure 2). At this point, the probability reflects the patient’s current quality of life or utility (Figure 2).
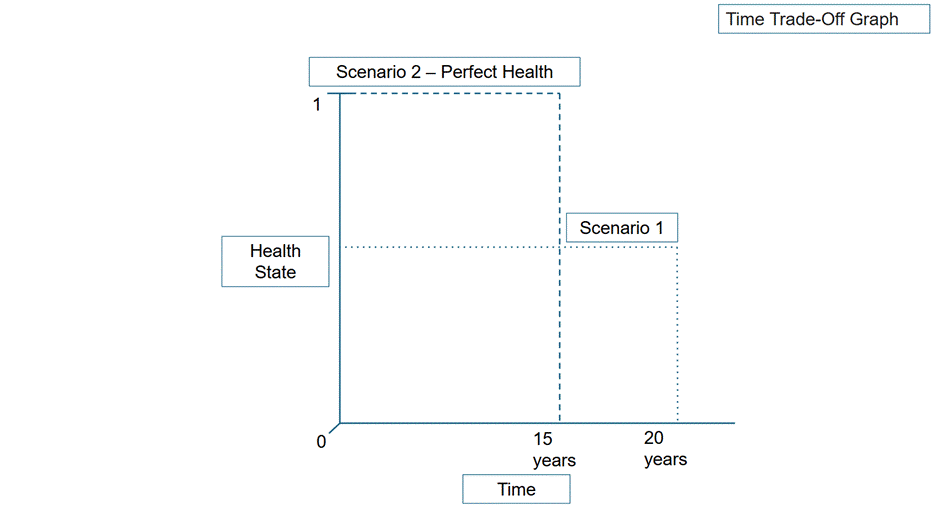
In the Time Trade-Off Method, utility is assessed based on how many years of life a patient would be willing to give up in exchange for perfect health (Arnold et al. 2009). For example, a patient with an orthopedic tumor causing chronic pain and restricted mobility might state they would trade 5 of their remaining 20 years to achieve perfect health. This equates to a utility of 0.75, as they prefer 15 years in perfect health over 20 years in their current condition (Figure 3).
_utility_assessment_illustrating_the_trade_between_length_of_life_and_.gif)
Despite the benefits of standard gamble and time-tradeoff methods, utility is more practically defined with the usage of conversions from health quality assessments in the form of questionnaires (Arnold et al. 2009; Phillippo et al. 2018). Utility is derived from outcome measures used in health economic analyses, which can further be stratified as general or disease specific. General outcome measures assess the patient’s overall health across multiple areas using questionnaires. An example of such a questionnaire in oncology is the Functional Assessment of Cancer Therapy General (FACT-G) scale, a validated instrument that evaluates quality of life in cancer patients by measuring physical, emotional, social, and functional well-being (Busija et al. 2011; Cella et al. 1993). However, the changes reflected in these general outcome measures often occur more gradually and may not capture immediate or short-term clinical effects as completely as process measures (e.g., hospital readmission rates or length of stay) (Lilford et al. 2007). Due to their consistency, there are benefits to using outcome measures to calculate utility in terms of QALY gained in CUAs. With disease-specific outcome measures, interpretations are rooted in diseases or body regions using questionnaires, such as the Musculoskeletal Tumor Society (MSTS) Score and Orthopedic Oncology Society (OOS) Functional Assessment Scale in the setting of bone metastases (Rizzo et al. 2024; Raman et al. 2016). The advantage of these disease-specific measures is that they are more specific and can more accurately assess healthcare outcomes following an intervention, thereby detecting treatment-related changes more precisely than general outcome measures. However, this specificity prevents comparison across different diseases which reduces its generalizability (Glasser et al. 2022). Disease-specific outcome measures are important for CEAs, but are less useful for CUAs, which require utility values. Thus, because utility is a patient-centered measure and required for proper representation of CUAs, outcome measures that translate into utility are often preferred.
In conclusion, for effective CUA calculations, it is crucial to utilize outcome measures that can be converted into utility values. General outcome measures are generally preferred over disease-specific ones due to their broader applicability and ease of conversion into utility scores. Despite this, disease-specific outcome measures are useful as they can highlight nuances of conditions, potentially offering greater sensitivity to changes within those specific health states. Prior work by Koster et al found that disease-specific patient reported outcomes (PROMs) can provide practitioners with more information on the effects of specific treatment decisions (Koster et al. 2023). While process measures provide important insights into healthcare delivery, they are unsuitable for utility calculations. Therefore, incorporating both general and disease-specific outcome measures, where feasible, ensures a thorough evaluation of intervention value and quality. For orthopedic oncology patients, quality outcomes extend beyond survival to include pain, mobility, limb function, and independence, underscoring the importance of quality metrics that reflect oncologic and functional success.
Time
Quality-adjusted life years (QALYs) are the result of multiplying a utility score by the length of time spent in that health state. This measure reflects both life quality and duration, and changes can be illustrated graphically by plotting utility over time (Whitehead and Ali 2010). QALYs gained from an intervention are represented by the difference in the area under the curve between the treatment and control groups respectively (Figure 2). If utility remains constant or improves, the intervention is interpreted as successful, effectively reducing the probability of future interventions and enhancing the intervention’s value.
The temporal aspect is crucial in assessing the impact of interventions, particularly surgical procedures. Initial postoperative phases often exhibit a reduction in utility due to pain and recovery, which may result in minimal or negative short-term QALY gains. However, as recovery progresses and utility improves, the long-term QALY gain typically increases, indicating the sustained value of the treatment. For example, an article by Chung et al. highlights a significant improvement in the utility of limb salvage compared to amputation, with patients undergoing limb salvage experiencing an additional 0.63 QALYs. This benefit is particularly pronounced in younger populations as every year of life remaining results in an additional 0.016 QALYs (Chung et al. 2009). This variation underscores the necessity of long-term follow-up to ascertain whether the initial benefits of an intervention are maintained or diminished. Accurate evaluations must integrate both immediate and long-term effects on utility to provide a comprehensive assessment of the intervention’s overall cost-effectiveness and quality of life impact. Thus, incorporating long-term data into the value equation is essential for a thorough understanding of an intervention’s efficacy and economic value.
Cost
In economics, costs represent the resources consumed, including both material items and services. They are typically grouped into indirect and direct categories (Weinstein et al. 1996). Indirect costs are not directly involved with patient care, including productivity losses associated with pathology, injury, or disability. Loss of productivity can be represented by the “human capital approach”, measured to be an individual’s wage, benefits, and the time they work. The friction cost method is commonly used as a substitute due to ambiguity with patients on permanent disability. In this approach, an estimate on the amount of time required for an employer to replace the disabled worker is produced (Pike and Grosse 2018). A significant challenge in either approach is the scenario in which a disabled employee continues to work through their impairment. However, calculating partial loss of productivity is complex, as their productivity may be reduced (Ratcliffe 1995). Furthermore, quantifying the productivity loss among caregivers presents an additional challenge. Recent literature on the financial burden of cancer caregiving indicates that caregivers often experience significant financial strain due to employment loss and the high cost and complexity of care. For instance, Bradley et al. estimated that the societal value of unpaid caregiving exceeds $470 billion annually, underscoring the disproportionate burden faced by caregivers (Cornelio and Burudpakdee 2014). These findings are particularly relevant in orthopedic oncology, where similar financial challenges may further complicate indirect cost estimates.
Direct costs refer to expenses that are directly tied to patient care, including diagnostic tests, medications, surgical procedures, and hospital admissions (Bradley 2019). For instance, treatment for patients with metastatic unresectable osteosarcoma can range from $32,173 to $117,675 per patient, depending on the chosen regimen (Paczkowska et al. 2014). The calculation of these costs is complicated by issues of transparency, disclosure, and lack of standardization, as different stakeholders—such as hospitals and insurance providers—often apply varying rates. Beyond institutional differences, regional variations in pricing further contribute to inconsistency. As a result, relying on sources like reimbursement data or patient self-reports may introduce inaccuracies, making precise measurements of direct costs challenging.
The costs associated with different treatment modalities for orthopedic tumors vary significantly. For example, the cost of administering high-dose chemotherapy for Ewing sarcoma on an outpatient basis is 21% lower than inpatient administration, saving approximately $4,500 per patient (Elshahoubi et al. 2019). Similarly, the costs of CT-guided radiofrequency ablation for osteoid osteoma are significantly lower compared to open surgical excision, $6,583.66 versus $13,826, demonstrating a substantial cost saving with the less invasive approach (Robinson 1993a). The importance of selecting cost-effective treatment modalities to manage orthopedic tumors efficiently is paramount. For example, there is a high per-patient lifetime medical cost for patients with metastatic soft tissue sarcoma (mSTS), estimated at $71,015. This cost encompasses various components of care, including chemotherapy, inpatient care, concomitant medication, and outpatient visits (Jönsson et al. 2016).
The modalities of treatment not only vary, but there are significant differences in the treatment costs for specific orthopedic tumors. For instance, the direct cost of managing craniospinal chordoma and chondrosarcoma through a Bundled Payment for Care Improvement (BPCI) model was found to be $49,425 for vertebral tumors and $60,853 for sacral tumors. The mean payments for cranial, mobile spine, and sacrococcygeal tumors over a 12-month period were $58,130, $84,854, and $82,440, respectively. These costs highlight the substantial financial resources required for the surgical management of orthopedic tumors, particularly about tumor type and location (Pockett et al. 2010).
In breast cancer treatment, hospital admission costs rise from $2,620 at initial diagnosis to $4,140 during the first admission for a skeletal-related event (SRE). Patients with prostate and lung cancer show similar trends, with costs increasing from $3,520 and $4,740, respectively, between diagnosis and their first SRE. These escalations are largely driven by longer hospital stays, more intensive treatments, and the need to manage complications associated with MBD and SREs. The progression of cancer to MBD, coupled with the heightened risk of SREs, substantially increases the financial burden on healthcare systems (Pockett et al. 2010).
Furthermore, orthopedic tumor surgeries, particularly those involving the spine and pelvis, are associated with high healthcare expenditures. The average monthly expenditure between all orthopedic subspecialties is $33,436, with orthopedic oncology reporting the highest expenditure among the orthopedic subspecialties at $41,795. Given that the annual national expenditure from orthopedic surgery is estimated to be $8.2 billion, this represents a significant financial burden and underscores the need for effective cost management strategies in orthopedic oncology (Sathiyakumar et al. 2014).
Discounting
Temporal discounting, a fundamental concept in health economics, reflects the tendency to value immediate benefits more than those realized in the future. This principal parallels finance, where $100 today is considered more valuable than $100 received a year from now because of potential investment returns and the effects of devaluation over time. Likewise, individuals place higher value on immediate health improvements compared to future gains (Brouwer et al. 2005). To account for this, health economic evaluations routinely apply discounts to adjust both costs and health outcomes to their present value.
Discount rates generally fall between 0% and 5% annually, with specific rates varying by country (Smith and Gravelle 2001). For example, Canada applies a discount rate of 1.5%, while the UK’s National Institute for Health and Care Excellence (NICE) utilizes a 3.5% rate for costs and a 1.5% rate for health effects in long-term interventions (Zuniga et al. 2020). These rates reflect the diminished value of future health outcomes and costs, acknowledging the greater value assigned to immediate benefits. Sheffer et al conducted research on a multitude of cancer types and found that individuals with bone cancer exhibited significantly higher delay discounting rates compared to other cancers, outside of leukemia, with a mean delay discounting rate of −2.5 (Sheffer et al. 2018). This increased delay discounting rate means that patients with bone cancer were less likely to engage in healthy behaviors and less likely to show care for their future outcomes.
The use of discounting in cost-utility analyses (CUAs) varies widely across countries, with ongoing debate regarding the most appropriate rates and methods. While there is general agreement that both costs and health outcomes should be discounted to reflect their present value, the specific rates applied differ depending on national guidelines and economic contexts (Kim and Basu 2021). For instance, the World Health Organization (WHO) and the U.S. Panel on Cost-Effectiveness in Health and Medicine recommend applying a uniform discount rate of 3% to both costs and health outcomes (Haacker et al. 2020).
Despite these guidelines, the lack of standardization in discount rates remains a significant issue, affecting the consistency and accuracy of economic evaluations. Prior research has demonstrated a broad range of discount rates, from 0% to 10%, indicating a need for more uniform practices (Zuniga et al. 2020; Masters et al. 2017). Additionally, there is ongoing discussion about whether discount rates should be constant or variable over time, with some proposing non-constant rates to better align with diminishing future time preferences. The absence of a universally accepted discounting approach highlights the need for further research to establish standardized discount rates and enhance methodological precision in health economic analyses. This variability impacts the valuation of health interventions, emphasizing the importance of careful selection and application of discount rates in cost-effectiveness studies. Because benefits often accrue long after treatment, discounting is essential for evaluating the long-term value of orthopedic oncology interventions.
Cost Effectiveness
Cost-utility analysis (CUA) measures the value of a healthcare intervention in terms of Quality-Adjusted Life Years (QALYs) per unit of cost. Its reciprocal cost per QALY provides a straightforward estimate of the expense required to gain an additional QALY. This measure, known as the Incremental Cost-Effectiveness Ratio (ICER), is then compared against established societal willingness-to-pay thresholds to determine cost-effectiveness (Cleemput et al. 2011; Vavken and Bianchi 2011). In the United States, a commonly referenced threshold is $50,000 - $100,000 per QALY, although $50,000 is the most used metric (Neumann et al. 2014).
\[\text{Value is cost-effective if} \leq \frac{$50,000}{\text{(QALY)}}\]
The determination of cost-effectiveness varies significantly by country, reflecting differences in economic conditions and healthcare funding priorities. Thresholds are often aligned with a country’s per capita Gross Domestic Product (GDP), with higher-income nations generally employing higher thresholds. In higher-income countries, such as the United States, the threshold is typically set around $100,000 per QALY, while lower-income nations like the Democratic Republic of Congo and Haiti have thresholds of $87 and $261, respectively (Pichon Riviere et al. 2023). The selection of these thresholds is influenced by both economic factors and ethical considerations, leading to variability in cost-effectiveness assessments across different regions.
The impact of timing and intervention type on cost-effectiveness is evident in clinical examples. A study by Dvortsin et al found that patients in the Netherlands and Scotland who underwent early-stage cancer treatment with cetuximab, bosutinib, and trastuzumab is considered cost-effective at a threshold of €80,000/QALY, whereas their late-stage counterparts exceed this threshold, demonstrating how early intervention can significantly improve cost-effectiveness in cancer care (Dvortsin et al. 2016). Furthermore, Konski et al found that in the treatment of metastatic bone disease, a single fraction of radiation may be just as effective as multiple fractions, while being significantly more cost effective (Konski et al. 2009). While these methods provide valuable insights, they do not address the practical aspects of intervention implementation or feasibility (Bertram et al. 2016). Therefore, a comprehensive evaluation must also account for broader factors beyond mere cost-effectiveness to fully capture the impact of healthcare interventions.
Clinical Decision Analysis
Decision analysis models, particularly decision trees and Markov models, are key tools for assessing the cost-effectiveness of healthcare interventions (Gupta et al. 2020). Decision trees provide a straightforward structure for mapping possible outcomes, organizing probabilities and consequences in a linear format. This makes them well-suited for scenarios with few health state transitions and shorter time horizons. In contrast, Markov models employ matrix algebra to represent transitions between multiple health states over time, making them more appropriate for complex conditions and long-term evaluations.
In the context of orthopedic oncology, Markov models have been applied to simulate the long-term outcomes of patients with spinal metastatic disease, integrating variables such as disease progression, quality of life, and treatment-related complications (Sonnenberg and Beck 1993). Schoenfeld et al. developed a Markov model to simulate the long-term outcomes of patients with spinal metastatic disease undergoing different treatment approaches (operative vs. nonoperative management). This model incorporated factors such as disease progression, treatment outcomes, patient quality of life, and healthcare costs (Schoenfeld et al. 2021). With transition probabilities, utility values, and cost data, the model enabled the assessment of both the clinical effectiveness and cost-effectiveness of the treatments, evaluating health outcomes in terms of Quality-Adjusted Life Years (QALYs) and associated financial expenditures. Although Markov models provide a comprehensive view of patient progression, their increased complexity may not always enhance the accuracy of cost-effectiveness evaluations compared to decision trees.
In orthopedic oncology, decisions trees have been employed to predict clinical outcomes after lumbar decompression surgeries by incorporating factors such as pain severity and vertebral slippage (Aleem et al. 2008). Yapar et al utilized a decision tree to evaluate mortality in Primary Malignant Bone Tumors (PMBTs) through measurable predictors such as stage, age, and grade variables (Yapar et al. 2023). Using this model, the study effectively improved the ability to predict clinical outcomes based on nodes rooted in clinical presentation, enabling physicians to modify treatments accordingly. While decision trees have been effectively applied in various orthopedic procedures, there is currently limited literature demonstrating their direct use in orthopedic oncology. This gap suggests a promising opportunity for future research to explore the applicability and potential benefits of decision tree models in predicting outcomes for orthopedic oncology patients.
Both decision trees and Markov models play an important role in clinical decision-making by evaluating the cost-effectiveness and overall value of treatment options. Decision trees are appreciated for their simplicity and clarity in depicting a limited number of health state possibilities, making them useful across a range of scenarios. Markov models, on the other hand, can capture more complex and time-dependent outcomes, though the added detail may not always change conclusions if it does not meaningfully affect cost-effectiveness estimates. It is important to recognize that while these models help standardize decision-making, they may overlook individual patient factors—such as medical history—that can influence the relevance of the results. Ultimately, both approaches are essential for identifying cost-effective treatment strategies, but they should be applied with an understanding of their limitations and the clinical context.
Discussion
The economic burden of orthopedic tumor treatments is profound, necessitating comprehensive cost management strategies to mitigate financial strain on healthcare systems. This review highlights the significant direct and indirect costs associated with metastatic bone disease (MBD) and orthopedic tumor surgeries, underscoring the need for innovative approaches to decrease these substantial costs. Additionally, addressing socioeconomic and geographic disparities is critical for improving access to care and ensuring equitable treatment outcomes. Patients from lower socioeconomic backgrounds and underserved areas face higher treatment costs and poorer outcomes, emphasizing the need for targeted interventions to enhance access and support.
The substantial cost of surgery for orthopedic tumors highlights the importance of adopting cost-effective strategies such as telemedicine, early referral to specialized centers, and refinement of surgical techniques to reduce complications and financial strain. From a socioeconomic perspective, reducing disparities and improving access are critical for promoting equity in healthcare. Cost-utility analysis using QALYs offers valuable insight into the cost-effectiveness of treatments, though challenges remain in standardizing discount rates and accurately measuring total costs. Greater efficiency, higher-quality care, and cost reduction can be further supported through bundled payment models and value-based care initiatives.
A multifaceted approach that includes cost-saving measures, equitable healthcare practices, and advanced economic evaluations is essential for managing the financial burden of orthopedic tumor treatments. By adopting these strategies, healthcare systems can improve patient outcomes while maintaining economic sustainability.
Acknowledgements
The authors have no additional acknowledgements.