This website uses cookies

We use cookies to enhance your experience and support COUNTER Metrics for transparent reporting of readership statistics. Cookie data is not sold to third parties or used for marketing purposes.

Skip to main content
null
J Orthopaedic Experience & Innovation
  • Menu
  • Articles
    • Brief Report
    • Case Report
    • Case Series
    • Conference Proceedings
    • Data Paper
    • Editorial
    • Meeting Reports/Abstracts
    • Methods Article
    • Product Review
    • Research Article
    • Review Article
    • Review Articles
    • Systematic Review
    • All
  • For Authors
  • Editorial Board
  • About
  • Issues
  • Blog
  • "Open Mic" Topic Sessions
  • Advertisers
  • Recorded Content
  • CME
  • JOEI KOL Connect
  • search
  • RSS feed (opens a modal with a link to feed)

RSS Feed

Enter the URL below into your favorite RSS reader.

http://localhost:40423/feed
ISSN 2691-6541
Research Article
Vol. 7, Issue 1, 2026June 18, 2026 EDT

Total Hip Arthroplasty in the Bundled Payments for Care Improvement Advanced Model: Who Will Bust the Bundle?

Penelope N. Halkiadakis, M.D., M.P.H., Simran Sahnan, M.P.H., Alison K. Klika, M.S., Chao Zhang, M.S., Jordan McInerney, M.H.A., Wael Barsoum, M.D.,
THAtotal hip arthroplastyBPCI-Abundled paymentPGPconvener
Copyright Logoccby-nc-nd-4.0 • https://doi.org/10.60118/001c.157866
J Orthopaedic Experience & Innovation
Halkiadakis, Penelope N., Simran Sahnan, Alison K. Klika, Chao Zhang, Jordan McInerney, and Wael Barsoum. 2026. “Total Hip Arthroplasty in the Bundled Payments for Care Improvement Advanced Model: Who Will Bust the Bundle?” Journal of Orthopaedic Experience & Innovation 7 (1). https://doi.org/10.60118/001c.157866.
Save article as...▾
Download all (2)
  • Figure 1
    Download
  • Figure 2
    Download

Error

Sorry, something went wrong. Please try again.

If this problem reoccurs, please contact Scholastica Support

Error message:

undefined

View more stats

Abstract

Background

Lower extremity joint replacement is the second largest inpatient expense to U.S. Centers for Medicaid & Medicare Services (CMS), prompting value-based care experimentation most recently seen in the Bundled Payment for Care Improvement Advanced Model (BPCI-A). BPCI-A tested a new target pricing methodology and welcomed acute care hospital, physician group practice (PGP), and convener participants.

Objective

To identify patient and facility factors predictive of primary total hip arthroplasty (THA) episode costs exceeding target payment for PGP clients of a value-based convener in the BPCI-A.

Methods

From 29 PGPs across BPCI-A Model Years 3-5 (2020-2022), 4,178 THAs were analyzed. There were 901 bundle busters (22%), defined as patients whose 90-day episode costs exceeded the final target price set by CMS during reconciliation. A predictive multivariable logistic regression model was built from demographics, prior post-acute care use, comorbidities, total comorbidity burden, major teaching hospital status, urban/rural designation, safety net status, census division and bed size. Model performance was calculated using the C-statistic, and the relative contribution of variables were assessed by Akaike information criterion.

Results

Significant predictors included model year (P = 0.001), MS-DRG (P < 0.001), prior post-acute care (P = 0.004), myasthenia gravis/myoneural disorders/inflammatory and toxic neuropathies (P = 0.049), coagulation defects and other hematologic disease (P = 0.011), metastatic cancer or acute leukemia (P = 0.029), and total HCC (P = 0.034). Compared to New England, six census divisions had lower odds of exceeding target prices (P ≤ 0.003). When compared to small bed size, large and extra-large bed size had higher odds of exceeding target price (P = 0.014). The model’s discriminative power was moderate (c-statistic = 0.678).

Conclusions

This is the first study of PGP-convener partnerships in BPCI-A and spans three model years across all census divisions utilizing real target price and reconciliation data, offering the most comprehensive view of PGP THA performance in BPCI-A. While several patient and facility factors were significantly associated with exceeding the target payment, they had limited discriminatory ability in predicting excess costs after THA for PGP-convener partners. As bundled payment models evolve, refined predictive models are needed to empower PGPs and conveners to strategically redesign care, especially as CMS signaled a future for PGP-specific models.

Introduction

Lower extremity joint replacement (LEJR) is the second-largest inpatient expense to the U.S. Centers for Medicare & Medicaid Services (CMS), and the demand is growing (Springer and McInerney 2021; Shichman et al. 2023). In response, CMS tests alternative payment models (APMs) that move away from fee-for-service (FFS) and promote value-based care (VBC)—including nearly two decades spent refining bundled payment programs (Carter Clement et al. 2017). Today, over half of arthroplasty surgeons participate in these models (Rana et al. 2022). Bundled payments hold healthcare teams accountable for cost, quality, and outcomes to encourage efficiency and financial savings. The Bundled Payments for Care Improvement Advanced Model (BPCI-A), launched in 2018, was a voluntary APM that built on lessons from Comprehensive Care for Joint Replacement (CJR) and Bundled Payments for Care Improvement (BPCI) Models. Under BPCI-A, acute care hospitals (ACHs), physician group practices (PGPs), and conveners joined as participants (episode initiators) and assumed financial risk for the quality and cost of care for Medicare beneficiaries during a clinical episode. Conveners, who represented the majority of BPCI-A initiators, supported ACHs and PGPs at the frontlines of healthcare system transformation by promoting BPCI-A participation, assuming in-part or all of the financial risk, and implementing cost-saving evidence-based strategies and quality improvement initiatives – such as preoperative patient optimization programs, modified anesthesia protocols, accelerated physical therapy timelines, same-day discharge, and safe discharge home (Lewin Group Inc. 2024; Berlin et al. 2021; Featherall et al. 2018; Debbi et al. 2022).

Each inpatient episode, including Medicare Severity-Diagnosis Related Group (MS-DRG) 469 (major replacement or reattachment of lower extremity with major complications or comorbidities) and MS-DRG 470 (without major complications or comorbidities), was assigned a target price for the period between hospitalization and 90-days post-discharge. At the end of the performance period, CMS reconciled participant FFS expenditures against an adjusted target price for each clinical episode initiated. Participants who kept net costs below the cumulative target prices earned a quality-adjusted reconciliation payment from CMS, while those exceeding the summed targets incurred a financial penalty and submitted a repayment to CMS (Somers et al. 2022; BPCI Advanced Target Price Specifications Model Year 4 2020). Bundled payments offer opportunities for shared savings but also expose participants to financial risk, particularly from “bundle busters”–patients whose care costs exceed the target payment. Higher episode cost often stems from increased care needs (Plate et al. 2016; Kurtz et al. 2017). Accurate prediction of high-cost THA episodes supports early patient optimization, targeted care pathway investments to better meet patient needs, and improvements to CMS’s target pricing methodology. A better understanding of risk stratification can also drive more appropriate use of inpatient versus outpatient status and enhanced reimbursement precision accuracy in FFS models.

PGPs are at the frontlines of THA delivery in the face of declining reimbursement and increasing patient comorbidities. PGPs were responsible for 73 percent of joint replacement episodes among BPCI-A participants in Model Years 1-2, outpacing hospitals (Crowley et al. 2025). Despite participating PGPs achieved greater reductions in spending compared to PGP nonparticipants and ACHs, they still faced negative mean reconciliation payments (Crowley et al. 2025; Shashikumar et al. 2024). Understanding the PGP experience in BPCI-A has key implications in encouraging PGPs to own their bundles and take a leading role in shaping the healthcare landscape. The purpose of this study was to determine which preoperative patient factors or facility characteristics were associated with exceeding the target payment (‘bundle busters’) in Medicare patients who underwent a primary elective THA as part of a BPCI-A bundle initiated by PGPs partnered with a single convener. We then sought to develop a predictive model to anticipate if a THA episode would exceed the target price.

Methods

Study Population

After receiving Institutional Review Board exemption for data analysis, a query of the enterprise data warehouse of a third-party VBC convener identified 4,178 consecutive patients who underwent elective inpatient THA through a PGP-partnership in BPCI-A bundles between January 2020 (Model Year 3) and December 2022 (Model Year 5). Of these, 120 (2.9%) cases were classified as MS-DRG 469. The total sample included 29 PGPs. For all but two clients, the convener assumed full downside risk, while PGPs retained a significant portion of shared savings. All PGPs were provided with advanced data analytics and care coordination support.

Patient Factors

As part of the patient case mix adjustment (PCMA) portion of target price calculation, CMS considered age, comorbidities (via CMS-Hierarchical Condition Categories, HCCs), comorbidity burden (total HCC count per beneficiary), and recent resource use in the 90-day period prior to the clinical episode (BPCI Advanced Target Price Specifications Model Year 4 2020; BPCI Advanced Target Price Specifications Model Years 1 and 2 2018; BPCI Advanced Model Overview Fact Sheet - Model Year 3 (MY3), n.d.; BPCI Advanced Target Price Specifications Model Year 5 2022). For the purposes of this study, we collected patient age, sex, long-term institutional or post-acute care (any home health or stay at a long-term care hospital, skilled nursing facility, or inpatient rehabilitation facility) in the 90-days prior, six co-occurring diagnoses, 78 HCC variables, and total HCCs. None of the patients in this study had the following HCCs: dialysis; cystic fibrosis; severe head injury; quadriplegia; coma, brain compression, anoxic damage; ALS and other motor neuron disease; traumatic amputations and complications; pressure ulcer of the skin with necrosis through to muscle, tendon, or bone; or severe skin burn or condition.

Facility Characteristics

A new element in BPCI-A target pricing methodology was the construction of ACH peer groups, created through regression models based on five factors: major teaching hospital status, urban/rural designation, safety net status, census region (Northeast, South, Midwest, and West), and bed size (small, medium, large, extra-large, missing) (Springer and McInerney 2021; BPCI Advanced Target Price Specifications Model Year 4 2020). We collected data on major teaching hospital status, urban/rural designation, safety net status, census division (New England, Middle Atlantic, East North Central, West North Central, South Atlantic, East South Central, West South Central, Mountain and Pacific) which comprise the census regions, and bed size (“Census Regions and Divisions of the United States,” n.d.). All THAs in our cohort were performed at urban, non-safety-net facilities.

Primary Outcome

In this study, ‘bundle busters’ were defined as patients whose 90-day episode costs exceeded the final target price set by CMS during reconciliation, as previously described in the literature (Wodowski et al. 2019). Episode costs are presented using claims data. During reconciliation, CMS calculated the final price by incorporating historic Medicare FFS expenditures during the baseline period (Standardized Baseline Spending), actual PCMA, persistent differences in patient-mix adjusted across peer groups (Peer Group Historical Adjustment Factor, PGHA), the difference between the projected (PGT) and realized (PGT Factor Adjustment) Peer Group Trend, and the CMS Discount. PGPs received target prices that were unique to their relative case mix and the hospital at which the procedure was performed (BPCI Advanced Target Price Specifications Model Year 4 2020; BPCI Advanced Target Price Specifications Model Year 5 2022).

Statistical Analyses

Summary statistics are presented as medians with interquartile ranges for continuous variables and counts with percentages for categorical variables. Multivariable logistic regression was used to investigate the relationship between patient factors and facility characteristics on exceeding the final target price (‘bundle buster’). Model results are presented as odds ratios (ORs) with 95% confidence intervals (CIs). Model performance was evaluated using the concordance statistic (C-statistic), where values range from 0.5-1 with higher values indicating better performance. Variables were ranked based on their relative contribution to the model, as assessed by the Akaike information criterion (AIC) increase upon removal of the variable from the full model. An AIC increase ≥ 2 indicates a statistically significant improvement in the model, with larger increases highlighting the importance of that variable in explaining the outcome. Data management and analysis were performed using R (Version 4.3.1; Vienna, Austria). All tests were two-sided with an alpha level of 0.05.

Results

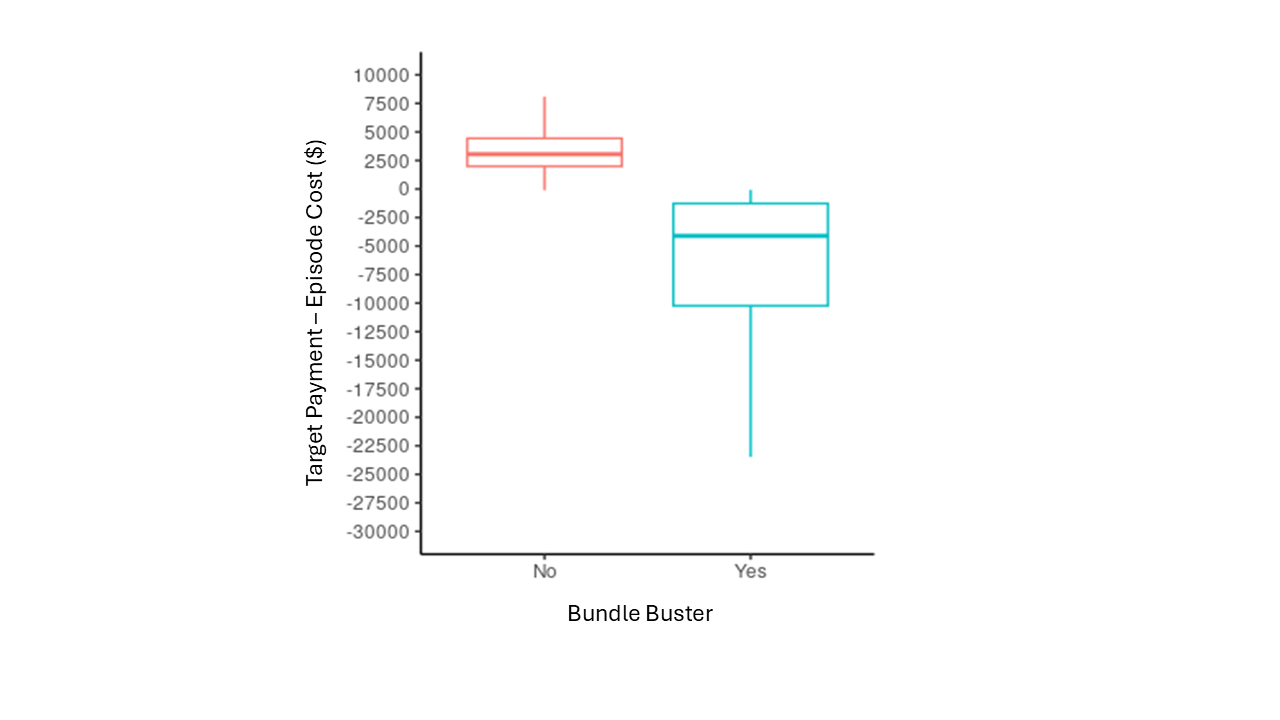
Of the 4,178 THAs included for analysis, 901 (21.6%) were bundle busters. Bundle busters had a median loss of $4,863 (IQR $1,429 - $13,617) whereas the median gain of a non-bundle buster was $3,069 (IQR $417 - $4,051) (Figure 1). More bundle busters were coded as MS-DRG 469 (P < 0.001). Overall, the number of total cases declined from Model Year 3 to Model Year 5, and the proportion of bundle busters increased annually (P < 0.001). (Table 1)

Figure 1
Figure 1
Table 1.BPCI-A Model Factors in Non-Buster and Buster Patients
Variable All Patients
(n=4,178)
Non-buster
(n=3,277)
Buster
(n=901)
P Value
Savings/Deficits 2,502 [417; 4,051] 3,069 [1,992; 4,465] -4,863 [-13,617;
-1,429]
0.000
MS DRG <0.001
469 120 (2.9%) 70 (2.1%) 50 (5.6%)
470 4,058 (97.1%) 3,207 (97.9%) 851 (94.5%)
Model Year <0.001
MY 3 2,436 (58.3%) 1,960 (59.8%) 476 (52.8%)
MY 4 1,642 (39.3%) 1,258 (38.4%) 384 (42.6%)
MY 5 100 (2.4%) 59 (1.8%) 41 (4.6%)

Significant P-values are bold
All categories listed as n (%) except Savings/Deficit which is reported as reported as median [interquartile range]
MS-DRG: Medicare Severity Diagnosis Related Group; MY: Model Year

Patient Factors

Bundle busters were older (P = 0.029) and utilized more post-acute care services (P < 0.001). Multiple co-occurring diagnoses and comorbidities were significantly different between bundle busters and non-bundle busters (Table 2).

Table 2.Patient Factors Associated with Non-Buster and Buster Patients
Variable All Patients
(n=4,178)
Non-buster
(n=3,277)
Buster
(n=901)
P Value
Age, years 73.0 [68.0; 78.0] 72.0 [68.0; 77.0] 73.0 [68.0;79.0] 0.029
Sex 0.099
Male 1,458 (34.9%) 1165 (35.6%) 293 (32.5%)
Female 2,720 (65.1%) 2112 (64.5%) 608 (67.5%)
Recent Resource Use
Long-Term Institutional Care * * * 0.119
Prior Post Acute Care 177 (4.2%) 112 (3.4%) 65 (7.2%) <0.001
Co-Occurring Diagnoses
Sepsis and Cardiorespiratory Failure and Shock * * * 0.119
Cancer and Disorders of Immunity * * * 0.014
CHF and COPD 47 (1.1%) 29 (0.9%) 18 (2.0%) 0.009
CHF and Renal Disease 22 (0.5%) 13 (0.4%) * 0.036
CHF and Diabetes 88 (2.1%) 59 (1.8%) 29 (3.2%) 0.013
COPD and Cardiorespiratory Failure and Shock 12 (0.3%) * * 0.149
Total HCC† 1.0 [0.0; 2.0] 1.0 [0.0; 2.0] 1.0 [0.0; 2.0] <0.001
Cardiac
CHF 269 (6.4%) 192 (5.9%) 77 (8.6%) 0.005
Heart Arrhythmia 487 (11.7%) 350 (10.7%) 137 (15.2%) <0.001
Angina Pectoris 44 (1.1%) * * * 0.464
Acute Myocardial Infarction 28 (0.7%) * * * 0.831
Acute Ischemic Heart Disease 13 (0.3%) * * 0.496
Cardiorespiratory failure and shock 27 (0.7%) 16 (0.5%) 11 (1.2%) 0.028
Respiratory
COPD 273 (6.5%) 189 (5.8%) 84 (9.3%) <0.001
Fibrosis of the Lung and Other Chronic Lung Disorders 46 (1.1%) 28 (0.9%) 18 (2.0%) 0.006
Respiratory Dependence / Tracheostomy Status * * * 0.216
Respiratory Arrest * * * 0.216
Diabetes
Without Complications 344 (8.2%) 264 (8.1%) 80 (8.9%) 0.467
With Acute Complications * * * 1.00
With Chronic Complications 436 (10.4%) 315 (9.6%) 121 (13.4%) 0.001
Renal
Acute Renal Failure 33 (0.8%) 18 (0.6%) 15 (1.7%) 0.002
Chronic Kidney Disease
Stage 4 27 (0.7%) * * 0.084
Stage 5 * * * 0.385
Protein-Calorie Malnutrition * * * 0.176
Metabolic Disorders 93 (2.2%) 68 (2.1%) 25 (2.8%) 0.257
Artificial Openings for Feeding or Elimination * * * 0.694
Digestive
End Stage Liver Disease * * * 0.295
Cirrhosis 11 (0.3%) * * 0.712
Chronic Hepatitis * * * 0.381
Intestinal Obstruction or Perforation * * * 0.044
Chronic Pancreatitis * * * 1.00
Inflammatory Bowel Disease 30 (0.7%) 19 (0.6%) 11 (1.2%) 0.073
Autoimmune
Rheumatoid Arthritis and Inflammatory Connective Tissue Disease 312 (7.5%) 205 (6.3%) 107 (11.9%) <0.001
Disorders of Immunity 39 (0.9%) 19 (0.6%) 20 (2.2%) <0.001
Myasthenia Gravis/ Myoneural Disorders / Inflammatory and Toxic Neuropathy 15 (0.4%) * * 0.752
Multiple Sclerosis * * * 0.416
Hematologic
Severe Hematological Disorders * * * 0.044
Coagulation Defects and Other Specified Hematological Disorders 161 (3.9%) 126 (3.8%) 35 (3.9%) 1.000
Infectious
Aspiration and Specified Bacterial Pneumonias * * * 1.00
Pneumococcal Pneumonia, Empyema, Lung Abscess * * * 0.458
Bone/Joint/Muscle Infections 81 (1.9%) 45 (1.4%) 36 (4.0%) <0.001
HIV/AIDS * * * 0.205
Opportunistic Infections * * * 0.119
Septicemia, Sepsis, Inflammatory Response Syndrome, or Shock * * * 0.044
Vascular Disease
Without Complications 320 (7.7%) 229 (7.0%) 91 (10.1%) 0.002
With Complications 50 (1.2%) 36 (1.1%) 14 (1.6%) 0.347
Dermatologic
Atherosclerosis of the Extremities with Ulceration or Gangrene * * * 0.295
Pressure Ulcer of Skin with Full Thickness Skin Loss * * * 0.119
Chronic Ulcer of Skin, Except Pressure 31 (0.7%) 19 (0.6%) 12 (1.3%) 0.035
Huntington’s Disease 33 (0.8%) * * 0.871
Muscular Dystrophy * * * 0.385
Complications of Specified Implanted Device or Graft 54 (1.3%) 40 (1.2%) 14 (1.6%) 0.537
Major Organ Transplant or Replacement Status * * * 0.648
Cancer
Metastatic Cancer and Acute Leukemia 32 (0.8%) 16 (0.5%) 16 (1.8%) <0.001
Lung and Other Severe Cancers 19 (0.5%) 16 (0.5%) * 0.780
Lymphoma and Other Cancers 29 (0.7%) * * 0.309
Colorectal, Bladder, and Other Cancers 52 (1.2%) 40 (1.2%) 12 (1.3%) 0.923
Breast, Prostate, and Other Cancers 182 (4.4%) 132 (4.0%) 50 (5.6%) 0.059
Ocular
Proliferative Diabetic Retinopathy and Vitreous Hemorrhage 12 (0.3%) * * 0.149
Exudative Macular Degeneration 44 (1.1%) * * 1.000
Neurologic
Major Head Injury * * * 0.119
Seizure Disorders and Convulsions 33 (0.8%) * * 0.871
Cerebral Hemorrhage * * * 1.000
Ischemic or Unspecified Strokes 42 (1.0%) 30 (0.9%) 12 (1.3%) 0.357
Monoplegia, Other Paralytic Syndromes * * * 0.216
Hemiplegia/ Hemiparesis * * * 0.043
Paraplegia * * * 0.216
Spinal Cord Disorders/Injuries 12 (0.3%) * * 0.028
Cerebral Palsy * * * 0.385
Psychiatric
Schizophrenia 12 (0.3%) * * 0.006
Bipolar and Paranoid Disorders 268 (6.4%) 194 (5.9%) 74 (8.2%) 0.016
Musculoskeletal
Amputation Status/ Lower Limb Amputation Complications * * * 0.416
Vertebral Fractures without Spinal Cord Injury * * * 0.238
Hip Fracture/ Dislocation 35 (0.8%) 13 (0.4%) 22 (2.4%) <0.001

All categories listed as n (%) except Age, Sex, and Total HCC which are reported as reported as median [interquartile range]
Significant P-values are bold
* Data masked due to n<11
CHF: Congestive Heart Failure; COPD: Chronic Obstructive Pulmonary Disease; HCC: Hierarchical Condition Category; HIV/AIDS: Human Immunodeficiency Virus / Acquired Immunodeficiency Syndrome

Facility Characteristics

More bundle busters underwent surgery at a major teaching hospital (P = 0.021) and at a large or extra-large hospital (P=0.004). Census division distribution also significantly differed (P < 0.001). (Table 3)

Table 3.Facility Characteristics Associated with Non-Buster and Buster Patients
Variable All Patients
(n=4,178)
Non-buster
(n=3,277)
Buster
(n=901)
P Value
Major Teaching Hospital 61 (1.5%) 40 (1.2%) 21 (2.3%) 0.021
Bed Size 0.004
Small 3,260 (78.0%) 2,585 (78.9%) 675 (74.9%)
Medium 600 (14.4%) 465 (14.2%) 135 (14.9%)
Large or Extra Large 318 (7.6%) 227 (6.9%) 91 (10.1%)
Census Division <0.001
New England 112 (2.7%) 66 (2.0%) 46 (5.1%)
Middle Atlantic 28 (0.7%) 15 (0.5%) 13 (1.4%)
East North Central 246 (5.9%) 191 (5.8%) 55 (6.1%)
West North Central 95 (2.3%) 58 (1.8%) 37 (4.1%)
South Atlantic 128 (3.1%) 99 (3.0%) 29 (3.2%)
East South Central 659 (15.8%) 504 (15.4%) 155 (17.2%)
West South Central 888 (21.3%) 747 (22.8%) 141 (15.7%)
Mountain 1,572 (37.6%) 1,216 (37.1%) 356 (39.5%)
Pacific 450 (10.8%) 381 (11.6%) 69 (7.7%)

Significant P-values are bold

Multivariate Logistic Regression

In multivariate logistic regression, higher odds of busting the bundle were associated with episodes occurring in Model Year 4 (OR 1.32, P = 0.001) or 5 (OR 2.35, P < 0.001), at large or extra-large hospitals (OR 1.57, P = 0.014), and among patients with prior post-acute care use (OR 1.71, P = 0.004), higher total HCC (OR 1.44, P = 0.034), or metastatic cancer and acute leukemia (OR 2.49, P = 0.029). Lower odds of busting the bundle were associated with MS-DRG 470 (OR 0.47, P < 0.001), coagulation defects and other specified hematological disorders (OR 0.49, P = 0.011) or myasthenia gravis, myoneural disorders, or inflammatory and toxic neuropathies (OR 0.19, P = 0.049). Compared to New England, THAs performed in the East North Central (OR 0.40, P = 0.002), South Atlantic (OR 0.39, P = 0.003), East South Central (OR 0.37, P < 0.001), West South Central (OR 0.27, P < 0.001), Mountain (OR 0.42, P = 0.001), and Pacific (OR 0.28, P < 0.001) divisions had lower odds of busting the bundle. (Table 4)

Table 4.Multivariable Logistic Regression Model Results for Busting THA BPCI-A Bundle
Variable OR (95% CI) P Value
MS-DRG 470 (vs 469) 0.47 (0.32 – 0.70) <0.001
Model Year
M4 (vs MY3) 1.32 (1.12 –⁠ 1.56) 0.001
MY5 (vs MY3) 2.35 (1.50 – 3.70) <0.001
Age, years 1.01 (0.99 – 1.02) 0.350
Gender, Female (vs. Male) 1.18 (1.00 – 1.40) 0.051
Prior Post Acute Care, yes (vs no) 1.71 (1.19 – 2.46) 0.004
CHF and COPD 1.04 (0.45 – 2.40) 0.925
CHF and Renal 0.55 (0.15 – 1.95) 0.352
COPD and Cardiorespiratory Failure 1.07 (0.21 – 5.54) 0.935
CHF and Diabetes 1.03 (0.53 – 1.98) 0.935
Total HCC 1.44 (1.03 – 2.00) 0.034
CHF 0.68 (0.40 – 1.16) 0.161
Heart Arrhythmia 0.86 (0.57 – 1.31) 0.492
Angina Pectoris 0.44 (0.18 – 1.10) 0.080
Acute Myocardial Infarction 0.83 (0.31 – 2.20) 0.710
Acute Ischemic Heart Disease 1.06 (0.29 – 3.93) 0.927
Cardiorespiratory failure and shock 0.93 (0.29 – 2.99) 0.161
COPD 0.99 (0.63 – 1.58) 0.983
Fibrosis of the Lung and Other Chronic Lung Disorders 1.36 (0.65 – 2.86) 0.410
Diabetes without Complications 0.84 (0.55 – 1.30) 0.437
Diabetes with Chronic Complications 0.88 (0.57 – 1.34) 0.549
Acute Renal Failure 1.58 (0.65 – 3.87) 0.314
Chronic Kidney Disease, Stage 4 1.31 (0.47 – 3.62) 0.607
Morbid Obesity 0.73 (0.47 – 1.13) 0.156
Metabolic Disorders 0.73 (0.40 – 1.33) 0.299
Cirrhosis 0.76 (0.17 – 3.48) 0.721
Inflammatory Bowel Disease 1.05 (0.42 – 2.64) 0.921
Rheumatoid Arthritis and Inflammatory Connective 1.15 (0.75 – 1.76) 0.525
Disorders of Immunity 1.46 (0.66 – 3.23) 0.357
Myasthenia Gravis/ Myoneural Disorders / Inflammatory and Toxic Neuropathy 0.19 (0.04 – 0.99) 0.049
Coagulation Defects and Other Specified Hematological Disorders 0.49 (0.29 – 0.85) 0.011
Bone/Joint/Muscle Infections 1.68 (0.91 – 3.08) 0.096
Vascular Disease without Complications 0.88 (0.57 – 1.36) 0.577
Vascular Disease with Complications 0.89 (0.41 – 1.91) 0.759
Chronic Ulcer of Skin, Except Pressure 1.19 (0.50 – 2.82) 0.700
Huntington’s Disease 0.88 (0.36 – 2.14) 0.773
Complications of Specified Implanted Device or Graft 0.76 (0.37 – 1.57) 0.466
Metastatic Cancer and Acute Leukemia 2.49 (1.10 – 5.64) 0.029
Lung and Other Severe Cancers 0.32 (0.08 – 1.22) 0.096
Lymphoma and Other Cancers 1.29 (0.52 – 3.21) 0.584
Colorectal, Bladder, and Other Cancers 0.68 (0.31 – 1.49) 0.337
Breast, Prostate, and Other Cancers and Tumors 1.01 (0.62 – 1.64) 0.972
Proliferative Diabetic Retinopathy and Vitreous Hemorrhage 1.59 (0.44 – 5.82) 0.480
Exudative Macular Degeneration 0.63 (0.27 – 1.47) 0.282
Seizure Disorders and Convulsions 0.61 (0.24 – 1.57) 0.306
Ischemic or Unspecified Strokes 0.66 (0.29 – 1.52) 0.329
Spinal Cord Disorders/Injuries 3.13 (0.90 – 10.89) 0.072
Schizophrenia 2.09 (0.58 – 7.46) 0.257
Bipolar and Paranoid Disorders 0.84 (0.53 – 1.32) 0.446
Hip Fracture/ Dislocation 2.08 (0.88 – 4.93) 0.097
Major Teaching Hospital, yes (vs no) 1.16 (0.63 – 2.22) 0.592
Bed Size
Medium (vs Small) 0.87 (0.66 – 1.15) 0.332
Large or Extra Large (vs Small) 1.57 (1.09 – 2.24) 0.014
Census Division
Middle Atlantic (vs New England) 0.88 (0.36 – 2.17) 0.778
East North Central (vs New England) 0.40 (0.22 – 0.71) 0.002
West North Central (vs New England) 0.82 (0.42 – 1.58) 0.556
South Atlantic (vs New England) 0.39 (0.21 – 0.73) 0.003
East South Central (vs New England) 0.37 (0.22 – 0.64) <0.001
West South Central (vs New England) 0.27 (0.16 – 0.45) <0.001
Mountain (vs New England) 0.42 (0.26 – 0.69) 0.001
Pacific (vs New England) 0.28 (0.17 – 0.46) <0.001

Significant P-values are bold
MS-DRG: Medicare Severity Diagnosis Related Group; MY: Model Year; CHF: Congestive Heart Failure; COPD: Chronic Obstructive Pulmonary Disease; HCC: Hierarchical Condition Category; HIV/AIDS: Human Immunodeficiency Virus / Acquired Immunodeficiency Syndrome

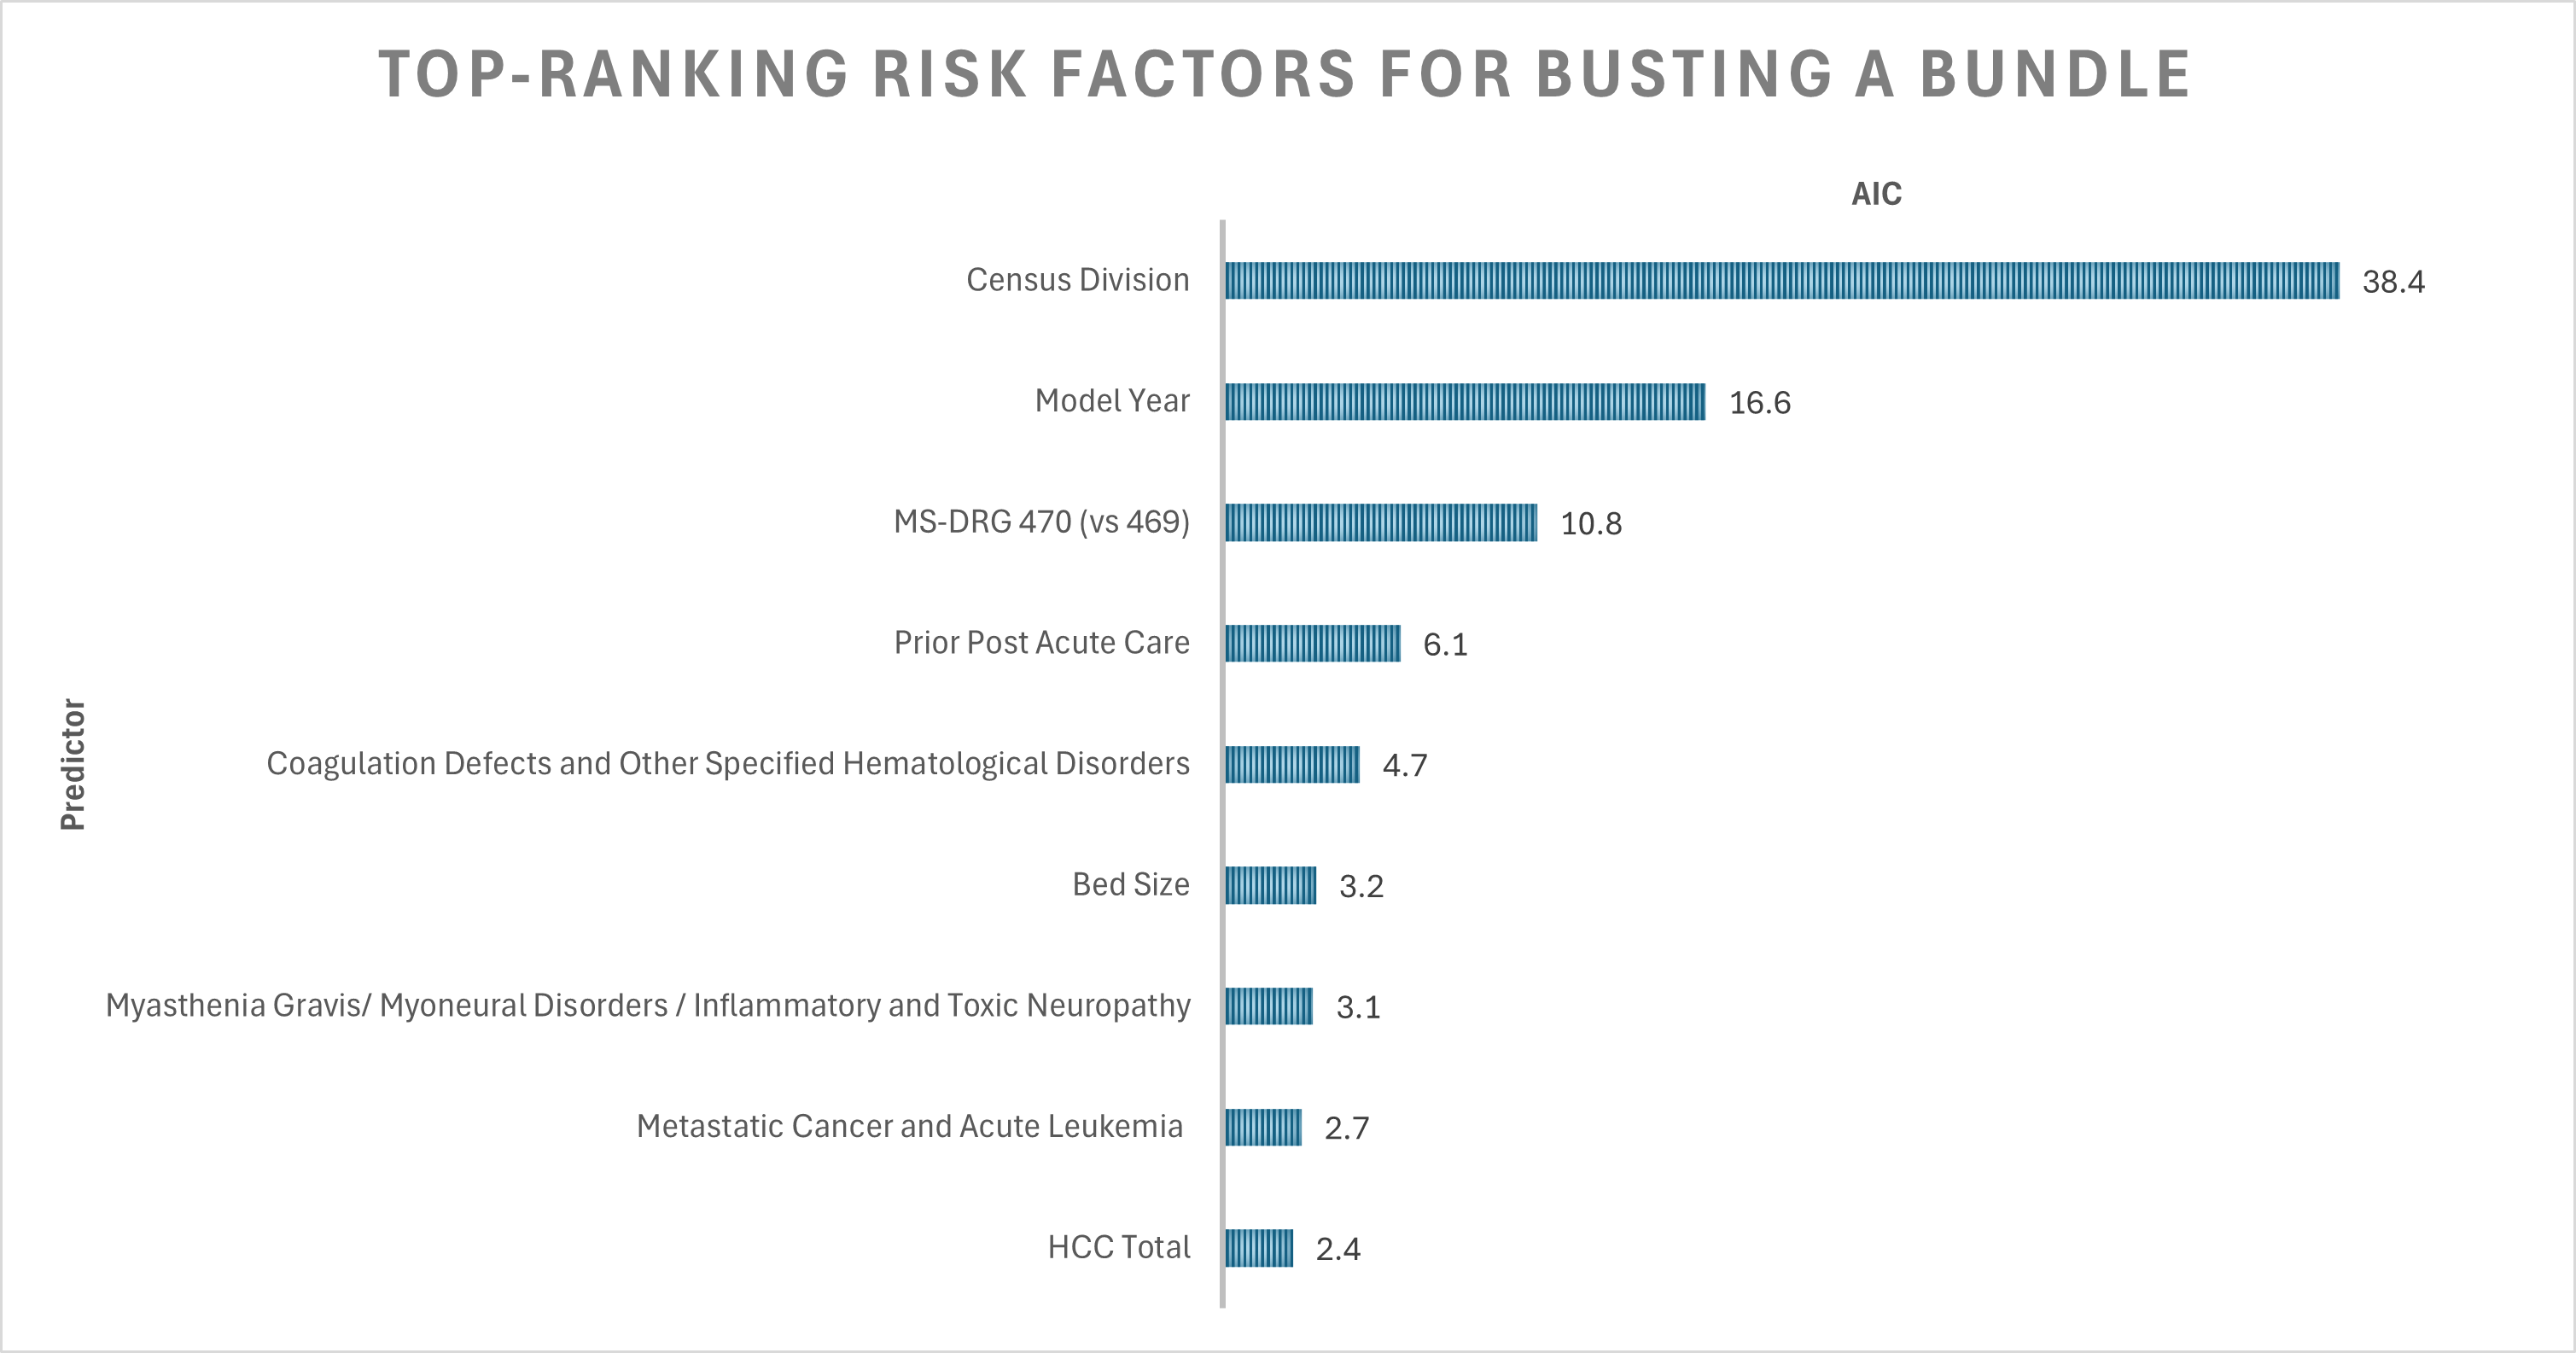
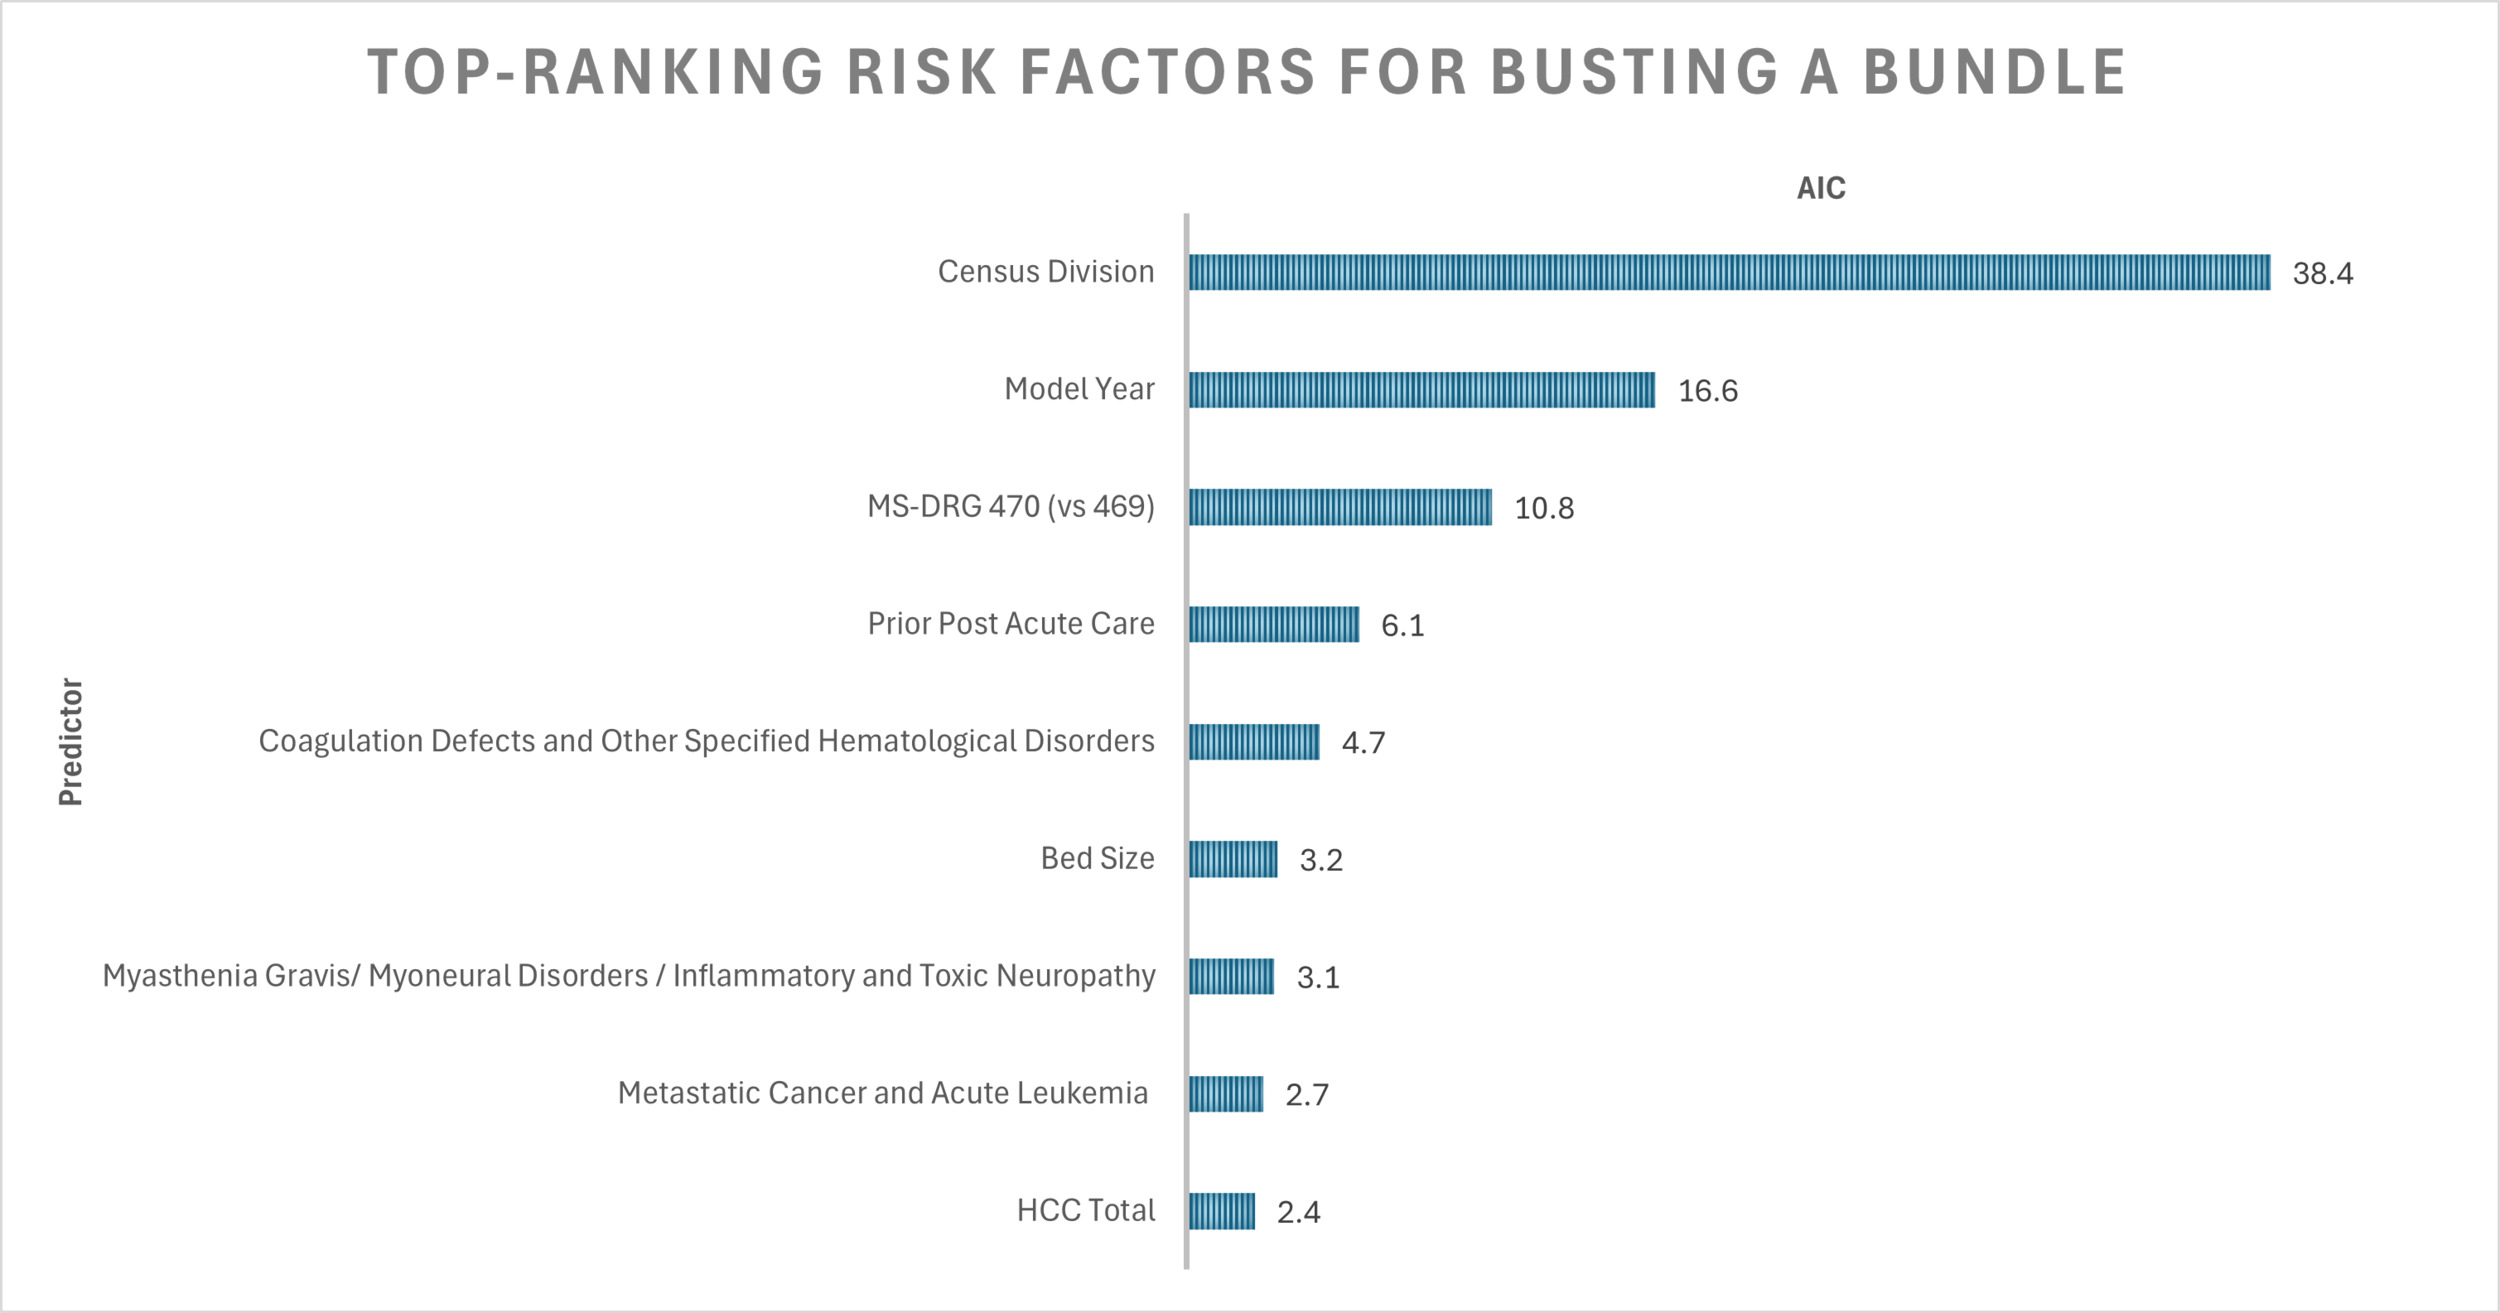
The C-statistic for this model was 0.678. Total HCC (AIC 2.4) was the ninth most important variable influencing the likelihood of exceeding target price, following census division (AIC 38.4), model year (AIC 16.6), MS-DRG (AIC 10.8), prior post-acute care (AIC 6.1), coagulation defects (AIC 4.7), bed size (AIC 3.2), myasthenia gravis (AIC 3.1), and metastatic cancer (AIC 2.7) (Figure 2).

Figure 2
Figure 2

Discussion

In our cohort of 4,178 Medicare patients undergoing primary elective inpatient THA within BPCI-A bundles initiated by PGPs partnered with a single convener, we identified nine factors that affected the odds of becoming a “bundle buster”, but our model had moderate discriminative power.

Success in a bundled payment model hinges on achieving clinically meaningful, patient-centered outcomes while keeping costs below the target. While orthopaedic surgeons aim for uncomplicated recoveries after elective THA, some patients inevitably require a higher level of care and greater resources (Bosco et al. 2014; Clair et al. 2016). CMS employed two strategies to limit the impact of outliers on reconciliation payments: a risk cap, in which the 1st and 99th percentile of spending was winsorsized, and stop- loss/gain limits, which capped the total reconciliation at 20% of the volume-weighted sum of the final net reconciliation amount (BPCI Advanced Model Year 5 Fact Sheet 2021). Nevertheless, participants remained financially vulnerable to “bundle busters” who drive net negative reconciliation payments (Springer and McInerney 2021; Krueger et al. 2021; Parikh et al. 2024).

Our study builds on prior research investigating patient factors associated with high-cost LEJR in bundled payment programs. Unlike Fillingham et al (Fillingham et al. 2020) who established a cut-off ($20,084) to define high-cost Medicare THA cases, we recognize the variability in CMS target prices complicates the ability to define a single cost-threshold. Different statistical methods – such as the Anderson-Darling test, boxplots, z-scores, 75th percentile, or a combination of the Shapiro-Wilk test, histogram evaluation, kurtosis test, and skewness evaluation – yield different outlier cutoffs. Episodes exceeding this arbitrary threshold may not always result in financial loss, and when they do, the deficit can vary widely due to the complexity of the target pricing methodology. Relying on simplistic statistical approaches to define outliers within non-parametric cost data is inherently flawed and fails to accurately capture the true financial risk assumed by participants. We believe predictive models should use the same definition of bundle busters as employed in this study and by Wodowski et al (Wodowski et al. 2019) and Ryan et al (Ryan, Goltz, et al. 2019). to accurately reflect the burden of bundle-busters. However, lacking actual target prices for 66% of cases, Ryan et al (Ryan, Goltz, et al. 2019) extrapolated backward from 2016 targets. Additionally, both authors combined multiple LEJR procedures in their analyses (Wodowski et al. 2019; Ryan, Goltz, et al. 2019). A key strength of our study is the use of real final target price data with a specific focus on THAs in BPCI-A. Unlike the previous-single institution studies, our dataset comprises PGPs nationwide, enhancing the generalizability of our findings and enabling analysis of PGT factor components, among which census division and bed size proved to be significant influences on our model.

In our multivariable logistic regression, patients who utilized post-acute care services in the 90-days before THA had 71% greater odds of being classified as a “bundle buster” (P = 0.004). This may reflect a patient preference of discharge destination, highlighting the need for preoperative patient education on the merits of home discharge when medically appropriate (Fang et al. 2020). Alternatively, this utilization may be a signal of frailty (Schuijt et al. 2021; Flinn et al. 2025; Nidadavolu et al. 2020). Frailty is associated with increased health expenditures and a higher risk of adverse events following LEJR (Tram et al. 2022; Ron et al. 2025). However, arthroplasty plays a crucial role in improving mobility, independence, and overall frailty in this patient population (Ron et al. 2025; Kappenschneider et al. 2024). Given these risks and benefits, CMS should incorporate frailty-based risk adjustments in their payment calculations. Incorporating prior post-acute care service utilization into dashboards on the electronic medical record can help physicians screen for frail patients who would benefit from targeted prehabilitation and postoperative interventions including improved care coordination with case management, physical therapy, and occupational therapy to align resources with patient needs, provide home health, and schedule timely postoperative follow-up visits (Crowley et al. 2025; Ron et al. 2025; Kappenschneider et al. 2024; Pearl et al. 2023).

Consistent with prior studies linking higher comorbidity burden to higher care needs, our model demonstrated that each additional HCC increased the odds of being classified as an outlier by 44% (P = 0.034) (Elings et al. 2015; Pasqualini et al. 2025). Recognizing the impact of comorbidities, the HCC lookback period was extended from 90 days to 180 days in Model Year 5 to improve model fit (BPCI Advanced Model Year 5 Fact Sheet 2021). Notably, no modifiable risk factors were significant, likely reflecting the substantial time and effort modern arthroplasty surgeons dedicate to preoperative optimization (Wasterlain et al. 2019). The only significant HCCs were coagulation defects and other hematologic disease, myasthenia gravis/myoneural disorders/inflammatory and toxic neuropathies, and metastatic cancer or acute leukemia. These conditions are associated with higher complication rates following arthroplasty (Challoumas et al. 2024; Sherman et al. 2021; Newman et al. 2018). Lower odds of exceeding target payments in patients with coagulation defects, neuromuscular disorders, and inflammatory neuropathies suggest an accurate accounting of risk.

In the first two years of BPCI-A, CMS paid $567 million in positive reconciliation and was on track for a $2 billion loss, prompting major target pricing adjustments (Daly 2020; Ryan et al. 2023). Model Year strongly predicts bundle busting, with odds increasing annually as CMS refined pricing to increase accuracy of target prices and find savings (Lewin Group Inc. 2024). Beginning in Model Year 3, baseline data used to assess historical performance shifted forward annually (BPCI Advanced Model Year 5 Fact Sheet 2021). Model Year 4 required participants to select service lines instead of unrelated bundles, introduced retrospective trend adjustments of peer group trends, and eliminated the PGP offset (Lewin Group Inc. 2024; BPCI Advanced Model Year 4 Fact Sheet, n.d.; Scheurer, n.d.). The removal of THA from the inpatient-only list in 2020 temporarily shifted healthier, less resource-intensive THA patients outside of bundle payments until Model Year 5 when outpatient hips were included (BPCI Advanced Model Year 5 Fact Sheet 2021; Parikh et al. 2024; Turcotte et al. 2020). This shift to ambulatory surgical centers likely explains bed size effect in our model, as higher-risk patients were treated at larger hospitals with more resources (BPCI Advanced Model Year 4 Fact Sheet, n.d.).

This study has several limitations. Our dataset is limited to the PGPs working with a single convener which took all downside risk in most of the agreements, such that PGPs received most of savings. As downside risk increased over time, other conveners in BPCI-A exited the program. The experience of PGPs and the impact of conveners on BPCI-A remains underexplored (Berlin et al. 2021; Shashikumar et al. 2024). This present study fills a gap by being the first to provide insight into PGP-convener partnerships in the context of THA in BPCI-A. PGPs play an important role in caring for Medicare beneficiaries. Conveners drive savings, expand participation in voluntary CMS models to create a more nationally representative sample, and guide PGPs through the complexities of APMs (Berlin et al. 2021; Somers et al. 2022; Murphy et al. 2019; Klika et al. 2025). Administrative claims data is vulnerable to miscoding, undercoding, and/or billing errors and the inability to assess other preoperative factors known to affect cost, such as patient-reported outcome measures, socioeconomic data, or history of mental health or substance abuse (Ryan, Goltz, et al. 2019; Squitieri et al. 2017; Courtney et al. 2017; Grits et al. 2022). While a potential criticism of our study is the inclusion of patients with both MS-DRG 469 and 470 designations, we believe MS-DRG codes provide inadequate risk stratification (Ryan, Plate, et al. 2019). MS-DRG codes are assigned at discharge, and physicians with greater awareness of billing codes can document the extent of patient comorbidities to justify the higher-reimbursed MS-DRG 469 designation if they anticipate a costlier post-operative course. Nevertheless, 42% of MS-DRG 469 patients exceeded their target price compared to 21% of MS-DRG 470 patients, highlighting that adjustments made for the major comorbidities and complications designation does not consistently align with true episode cost. Importantly, patients classified under MS-DRG 470 may still have risk factors associated with increased episode costs (Wodowski et al. 2019; Fillingham et al. 2020; Ryan, Plate, et al. 2019).

Despite these limitations, our findings have important implications as orthopaedic surgeons become increasingly engaged in APMs and must better understand financial risk in an evolving reimbursement landscape. By analyzing claims data and the final target prices provided by CMS for 29 PGP clients of a single convener, we identified nine factors associated with a bundle buster in BPCI-A. Equipped with this knowledge, physicians can take part in shaping the healthcare system of tomorrow. The upcoming Transforming Episode Accountability Model (TEAM), a new five-year mandatory episode-based payment model, reflects key learnings from CJR and BPCI-A and will replace these models in January 2026. Currently, it excludes PGPs and conveners as episode initiators due to concerns about episode attribution, care coordination services, and patient volume. Prior study has demonstrated that the greatest magnitude of savings were achieved by beneficiaries treated by both participating physicians and participating hospitals, signifying the potential for success in gainsharing approaches (Crowley et al. 2025). CMS signaled potential pathways for PGP involvement, whether through arrangements with TEAM participants, future consideration for TEAM inclusion, or new PGP-specific models (Centers for Medicare & Medicaid Services 2024). Refined predictive models are needed to empower PGPs and conveners to strategically redesign care to ensure high-quality THA for all patients across different practice models. Similar investigation should be performed for other orthopaedic procedures as bundles expand to total shoulder arthroplasty and common spine procedures.

Submitted: October 16, 2025 EDT

Accepted: February 18, 2026 EDT

References

Berlin, N. L., T. A. Peterson, Z. Chopra, B. Gulseren, and A. M. Ryan. 2021. “Hospital Participation Decisions In Medicare Bundled Payment Program Were Influenced By Third-Party Conveners.” Health Aff (Millwood) 40: 1286–93. https:/​/​doi.org/​10.1377/​hlthaff.2020.01766.
Google Scholar
Bosco, J. A., A. J. Karkenny, L. H. Hutzler, J. D. Slover, and R. Iorio. 2014. “Cost Burden of 30-Day Readmissions Following Medicare Total Hip and Knee Arthroplasty.” The Journal of Arthroplasty 29: 903–5. https:/​/​doi.org/​10.1016/​j.arth.2013.11.006.
Google Scholar
BPCI Advanced Model Overview Fact Sheet - Model Year 3 (MY3). n.d. Centers for Medicare & Medicaid Center for Medicare & Medicaid Innovation.
BPCI Advanced Model Year 4 Fact Sheet. n.d. Centers for Medicare & Medicaid Center for Medicare & Medicaid.
BPCI Advanced Model Year 5 Fact Sheet. 2021.
BPCI Advanced Target Price Specifications Model Year 4. 2020. Center for Medicare & Medicaid Innovation (Innovation Center).
BPCI Advanced Target Price Specifications Model Year 5. 2022. Center for Medicare & Medicaid Innovation (Innovation Center).
BPCI Advanced Target Price Specifications Model Years 1 and 2. 2018. Center for Medicare & Medicaid Innovation (Innovation Center).
Carter Clement, R., S. B. Bhat, M. E. Clement, and J. C. Krieg. 2017. “Medicare Reimbursement and Orthopedic Surgery: Past, Present, and Future.” Curr Rev Musculoskelet Med 10: 224–32. https:/​/​doi.org/​10.1007/​s12178-017-9406-7.
Google Scholar
“Census Regions and Divisions of the United States.” n.d.
Centers for Medicare & Medicaid Services. 2024. “Medicare and Medicaid Programs and the Children’s Health Insurance Program; Hospital Inpatient Prospective Payment Systems for Acute Care Hospitals and the Long-Term Care Hospital Prospective Payment System and Policy Changes and Fiscal Year 2025 Rates; Quality Programs Requirements; and Other Policy Changes.” Federal Register. https:/​/​www.federalregister.gov/​documents/​2024/​08/​28/​2024-17021/​medicare-and-medicaid-programs-and-the-childrens-health-insurance-program-hospital-inpatient.
Challoumas, D., D. Munn, G. Jeyakumar, C. Bagot, R. Rodgers, R. Kearns, et al. 2024. “Outcomes of Total Hip and Knee Arthroplasty in Patients with Haemophilia: A Meta-Analysis of Comparative Studies and Clinical Practice Recommendations.” Haemophilia 30: 180–94. https:/​/​doi.org/​10.1111/​hae.14904.
Google Scholar
Clair, A. J., P. J. Evangelista, C. M. Lajam, J. D. Slover, J. A. Bosco, and R. Iorio. 2016. “Cost Analysis of Total Joint Arthroplasty Readmissions in a Bundled Payment Care Improvement Initiative.” The Journal of Arthroplasty 31: 1862–65. https:/​/​doi.org/​10.1016/​j.arth.2016.02.029.
Google Scholar
Courtney, P. M., J. I. Huddleston, R. Iorio, and D. C. Markel. 2017. “Socioeconomic Risk Adjustment Models for Reimbursement Are Necessary in Primary Total Joint Arthroplasty.” The Journal of Arthroplasty 32: 1–5. https:/​/​doi.org/​10.1016/​j.arth.2016.06.050.
Google Scholar
Crowley, A. P., A. S. Kilaru, Q. E. Huang, E. Wang, J. Zhu, A. Arora, et al. 2025. “Physician and Hospital Performance in Medicare’s Updated Bundled-Payment Model for Joint Replacement.” JAMA Health Forum 6: e251930. https:/​/​doi.org/​10.1001/​jamahealthforum.2025.1930.
Google Scholar
Daly, R. 2020. “Big Medicare Bundled Payment Changes Could Cut Participation, Advisers Say.” Healthcare Financial Management Association. https:/​/​www.hfma.org/​payment-reimbursement-and-managed-care/​bundled-payment/​big-medicare-bundled-payment-changes-could-cut-participation-ad/​.
Debbi, E. M., G. M. Mosich, I. Bendich, M. Kapadia, M. P. Ast, and G. H. Westrich. 2022. “Same-Day Discharge Total Hip and Knee Arthroplasty: Trends, Complications, and Readmission Rates.” J Arthroplasty 37: 444-448.e1. https:/​/​doi.org/​10.1016/​j.arth.2021.11.023.
Google Scholar
Elings, J., T. Hoogeboom, G. Van Der Sluis, and N. Van Meeteren. 2015. “What Preoperative Patient-Related Factors Predict Inpatient Recovery of Physical Functioning and Length of Stay after Total Hip Arthroplasty? A Systematic Review.” Clin Rehabil 29: 477–92. https:/​/​doi.org/​10.1177/​0269215514545349.
Google Scholar
Fang, C., S. J. Lim, D. J. Tybor, J. Martin, M. E. Pevear, and E. L. Smith. 2020. “Factors Determining Home Versus Rehabilitation Discharge Following Primary Total Joint Arthroplasty for Patients Who Live Alone.” Geriatrics (Basel) 5: 7. https:/​/​doi.org/​10.3390/​geriatrics5010007.
Google Scholar
Featherall, J., D. P. Brigati, M. Faour, W. Messner, and C. A. Higuera. 2018. “Implementation of a Total Hip Arthroplasty Care Pathway at a High-Volume Health System: Effect on Length of Stay, Discharge Disposition, and 90-Day Complications.” The Journal of Arthroplasty 33: 1675–80. https:/​/​doi.org/​10.1016/​j.arth.2018.01.038.
Google Scholar
Fillingham, Y. A., C. A. Krueger, A. J. Rondon, C. Vannello, M. S. Austin, and P. M. Courtney. 2020. “Traditional Risk Factors and Logistic Regression Failed to Reliably Predict a ‘Bundle Buster’ After Total Joint Arthroplasty.” The Journal of Arthroplasty 35: 1458–65. https:/​/​doi.org/​10.1016/​j.arth.2020.01.036.
Google Scholar
Flinn, S. J., D. S. Silver, J. Hodges, A. L. Bilderback, D. Buchanan, J. M. Ludwig, et al. 2025. “Association of Frailty With Health Care Utilization for Patients Over One Year Following Surgical Evaluation.” Annals of Surgery 281: 280–87. https:/​/​doi.org/​10.1097/​SLA.0000000000006218.
Google Scholar
Grits, D., A. K. Emara, A. K. Klika, T. G. Murray, J. P. McLaughlin, and N. S. Piuzzi. 2022. “Neighborhood Socioeconomic Disadvantage Associated With Increased Healthcare Utilization After Total Hip Arthroplasty.” The Journal of Arthroplasty 37: 1980-1986.e2. https:/​/​doi.org/​10.1016/​j.arth.2022.04.041.
Google Scholar
Kappenschneider, T., P. Bammert, G. Maderbacher, F. Greimel, L. Parik, D. E. Holzapfel, et al. 2024. “The Impact of Primary Total Hip and Knee Replacement on Frailty: An Observational Prospective Analysis.” BMC Musculoskelet Disord 25: 78. https:/​/​doi.org/​10.1186/​s12891-024-07210-w.
Google Scholar
Klika, A., D. J. Jacofsky, and W. K. Barsoum. 2025. “Letter to the Editor: Value-Based Healthcare: The Impact of Consolidation in Healthcare on the Field of Orthopaedic Surgery.” Clin Orthop Relat Res. https:/​/​doi.org/​10.1097/​CORR.0000000000003460.
Google Scholar
Krueger, C. A., M. Yayac, C. Vannello, J. Wilsman, M. S. Austin, and P. M. Courtney. 2021. “From Winners to Losers: The Methodology of Bundled Payments for Care Improvement Advanced Disincentivizes Participation in Bundled Payment Programs.” The Journal of Arthroplasty 36: 1204–11. https:/​/​doi.org/​10.1016/​j.arth.2020.10.034.
Google Scholar
Kurtz, S. M., E. C. Lau, K. L. Ong, E. M. Adler, F. R. Kolisek, and M. T. Manley. 2017. “Which Clinical and Patient Factors Influence the National Economic Burden of Hospital Readmissions After Total Joint Arthroplasty?” Clin Orthop Relat Res 475: 2926–37. https:/​/​doi.org/​10.1007/​s11999-017-5244-6.
Google Scholar
Lewin Group Inc. 2024. CMS Bundled Payments for Care Improvement Advanced Model Fifth Evaluation Report.
Murphy, W. S., A. Siddiqi, T. Cheng, B. Lin, D. Terry, C. T. Talmo, et al. 2019. “2018 John Charnley Award: Analysis of US Hip Replacement Bundled Payments: Physician-Initiated Episodes Outperform Hospital-Initiated Episodes.” Clin Orthop Relat Res 477: 271–80. https:/​/​doi.org/​10.1097/​CORR.0000000000000532.
Google Scholar
Newman, J. M., T. C. Wagner, Q. Naziri, W. T. North, S. M. Navale, A. K. Klika, et al. 2018. “Hematologic Malignancies Are Associated with Adverse Perioperative Outcomes Following Total Knee Arthroplasty.” J Knee Surg 31: 291–301. https:/​/​doi.org/​10.1055/​s-0037-1603335.
Google Scholar
Nidadavolu, L. S., A. L. Ehrlich, F. E. Sieber, and E. S. Oh. 2020. “Preoperative Evaluation of the Frail Patient.” Anesth Analg 130: 1493–503. https:/​/​doi.org/​10.1213/​ANE.0000000000004735.
Google Scholar
Parikh, N., A. Lam, W. DiCiurcio, N. C. Matthew, B. Wellens, and C. A. Krueger. 2024. “Mapping the Institutional Healthcare Payer Mix for Total Hip and Knee Arthroplasty: Insight Into a Large Practice.” The Journal of Arthroplasty, S0883540324011574. https:/​/​doi.org/​10.1016/​j.arth.2024.10.117.
Google Scholar
Pasqualini, I., X. Pan, J. Xu, C. Austin, A. Ibaseta, S. T. Khan, et al. 2025. “Discharge Disposition after Total Hip Arthroplasty: A 10-Year Analysis of Trends and Predictors of Nonhome Discharge (2011-2021).” J Am Acad Orthop Surg. https:/​/​doi.org/​10.5435/​JAAOS-D-23-01242.
Google Scholar
Pearl, A., A. Ismail, T. Alsadi, Z. Crespi, M. Daher, and K. Saleh. 2023. “Frailty and Pre-Frailty in the Setting of Total Joint Arthroplasty: A Narrative Review.” Geriatr Orthop Surg Rehabil 14: 21514593231188864. https:/​/​doi.org/​10.1177/​21514593231188864.
Google Scholar
Plate, J. F., M. L. Brown, A. D. Wohler, T. M. Seyler, and J. E. Lang. 2016. “Patient Factors and Cost Associated with 90-Day Readmission Following Total Hip Arthroplasty.” The Journal of Arthroplasty 31: 49–52. https:/​/​doi.org/​10.1016/​j.arth.2015.07.030.
Google Scholar
Rana, A. J., A. J. Yates, B. D. Springer, J. I. Huddleston, and R. Iorio. 2022. “Hip and Knee Arthroplasty Alternative Payment Model Successes and Challenges.” Arthroplast Today 13: 154–56. https:/​/​doi.org/​10.1016/​j.artd.2021.11.013.
Google Scholar
Ron, D., A. B. Daley, M. P. Coe, M. D. Herrick, R. H. Roth, A. T. Abess, et al. 2025. “Frailty and Associated Healthcare Expenditures among Patients Undergoing Total Hip and Knee Arthroplasty.” The Journal of Frailty & Aging 14: 100030. https:/​/​doi.org/​10.1016/​j.tjfa.2025.100030.
Google Scholar
Ryan, A. M., S. A. Shashikumar, Z. Chopra, K. E. Joynt Maddox, and J. D. Buxbaum. 2023. “Reconciliation Payments in the Bundled Payments for Care Improvement Advanced Program and Reductions in Clinical Spending Needed for CMS to Avoid Financial Losses.” JAMA 329: 1221–23. https:/​/​doi.org/​10.1001/​jama.2023.1435.
Google Scholar
Ryan, S. P., D. E. Goltz, C. B. Howell, W. A. Jiranek, D. E. Attarian, M. P. Bolognesi, et al. 2019. “Predicting Costs Exceeding Bundled Payment Targets for Total Joint Arthroplasty.” The Journal of Arthroplasty 34: 412–17. https:/​/​doi.org/​10.1016/​j.arth.2018.11.012.
Google Scholar
Ryan, S. P., J. F. Plate, D. E. Goltz, D. E. Attarian, S. S. Wellman, T. M. Seyler, et al. 2019. “Should Medical Severity-Diagnosis Related Group Classification Be Utilized for Reimbursement? An Analysis of Elixhauser Comorbidities and Cost of Care.” The Journal of Arthroplasty 34: 1312–16. https:/​/​doi.org/​10.1016/​j.arth.2019.02.045.
Google Scholar
Scheurer, D. n.d. SHM Opposes CMS’ Proposal to Eliminate BPCIA’s Physician Group Practice (PGP) Offset 2020.
Google Scholar
Schuijt, H. J., M. L. Morin, E. Allen, and M. J. Weaver. 2021. “Does the Frailty Index Predict Discharge Disposition and Length of Stay at the Hospital and Rehabilitation Facilities?” Injury 52: 1384–89. https:/​/​doi.org/​10.1016/​j.injury.2021.01.004.
Google Scholar
Shashikumar, S. A., Z. Chopra, J. D. Buxbaum, K. E. Joynt Maddox, and A. M. Ryan. 2024. “Physician Group Practices Accrued Large Bonuses Under Medicare’s Bundled Payment Model, 2018–20: Study Examines Medicare’s Bundled Payments to Physician Group Practices.” Health Affairs 43: 623–31. https:/​/​doi.org/​10.1377/​hlthaff.2023.00915.
Google Scholar
Sherman, W. F., V. J. Wu, S. A. Ofa, B. J. Ross, I. D. Savage-Elliott, and F. L. Sanchez. 2021. “Increased Rate of Complications in Myasthenia Gravis Patients Following Hip and Knee Arthroplasty: A Nationwide Database Study in the PearlDiver Database on 257,707 Patients.” Acta Orthop 92: 176–81. https:/​/​doi.org/​10.1080/​17453674.2020.1865031.
Google Scholar
Shichman, I., M. Roof, N. Askew, L. Nherera, J. C. Rozell, T. M. Seyler, et al. 2023. “Projections and Epidemiology of Primary Hip and Knee Arthroplasty in Medicare Patients to 2040-2060.” JB JS Open Access 8: e22.00112. https:/​/​doi.org/​10.2106/​JBJS.OA.22.00112.
Google Scholar
Somers, J., Aylin Bradley, Kelsey Bacon, Sarah Bergman, Shannon Bicott, Reed Cammarota, et al. 2022. CMS Bundled Payments for Care Improvement Advanced Model: Third Evaluation Report. Lewin Group, Inc.
Springer, B. D., and J. McInerney. 2021. “Medicare Bundles for Arthroplasty: A Journey Back to Fee for Service?” The Bone & Joint Journal 103-B: 119–25. https:/​/​doi.org/​10.1302/​0301-620X.103B6.BJJ-2020-2315.R1.
Google Scholar
Squitieri, L., K. J. Bozic, and A. L. Pusic. 2017. “The Role of Patient-Reported Outcome Measures in Value-Based Payment Reform.” Value in Health 20: 834–36. https:/​/​doi.org/​10.1016/​j.jval.2017.02.003.
Google Scholar
Tram, M. K., C. M. O’Connor, A. S. Qian, J. T. Tram, and M. W. Tetreault. 2022. “Frailty Is Associated With Increased 30-Day Adverse Events and Hospitalization Costs After Primary Total Hip Arthroplasty.” The Journal of Arthroplasty 37: S925-S930.e4. https:/​/​doi.org/​10.1016/​j.arth.2022.01.047.
Google Scholar
Turcotte, J. J., N. Menon, J. M. Aja, J. J. Grover, P. J. King, and J. H. MacDonald. 2020. “Preoperative Predictors of Patients Requiring Inpatient Admission for Total Hip Arthroplasty Following Removal From the Medicare Inpatient-Only List.” The Journal of Arthroplasty 35: 2109-2113.e1. https:/​/​doi.org/​10.1016/​j.arth.2020.03.038.
Google Scholar
Wasterlain, A. S., P. M. Courtney, M. F. Yayac, D. G. Nazarian, and M. S. Austin. 2019. “Quantifying the Perioperative Work Associated With Total Hip and Knee Arthroplasty: The Burden Has Increased With Contemporary Care Pathways.” The Journal of Arthroplasty 34: 2528–31. https:/​/​doi.org/​10.1016/​j.arth.2019.06.039.
Google Scholar
Wodowski, A. J., C. E. Pelt, J. A. Erickson, M. B. Anderson, J. M. Gililland, and C. L. Peters. 2019. “‘Bundle Busters’: Who Is at Risk of Exceeding the Target Payment and Can They Be Optimized?” Bone Joint J 101-B: 64–69. https:/​/​doi.org/​10.1302/​0301-620X.101B7.BJJ-2018-1522.R1.
Google Scholar

Attachments

Powered by Scholastica, the modern academic journal management system