
INTRODUCTION
Reverse total shoulder arthroplasty (rTSA) has become the standard of care for the management of rotator cuff arthropathy (RCA). Since its approval by the U.S. Food and Drug Administration in 2004, rTSA utilization has increased substantially, with annual procedures in the United States rising from 22,835 in 2012 to 62,705 in 2017 (Best, 2021). Originally introduced by Grammont in 1987, rTSA inverts the native shoulder anatomy by implanting a convex glenoid ball on the scapula and a concave socket on the humerus. This configuration shifts the center of rotation inferomedially, enhancing the mechanical advantage of the deltoid muscle and reducing dependence on a deficient rotator cuff for abduction and rotation (Flatow and Harrison 2011; Meisterhans et al. 2019). Consequently, rTSA is the preferred surgical intervention for restoring shoulder function in patients with RCA.
Accurate assessment of glenoid morphology is critical for successful outcomes in shoulder arthroplasty. Preoperative evaluation of glenoid version, inclination, bone stock, and erosion patterns directly influence implant selection and component orientation. Historically, RCA was characterized using two-dimensional (2D) classification systems – including the Seebauer, Sirveaux, and Hamada systems – which assess humeral head position, glenoid erosion patterns, and arthropathy progression, respectively (Brolin et al. 2017; Kappe et al. 2011; Sirveaux et al. 2004). However, 2D imaging modalities have demonstrated limitations in accurately quantifying glenoid version and inclination. Budge et al. directly compared axial 2D CT measurements with 3D reconstructions corrected to the plane of the scapula and found that nearly half of 2D measurements differed by more than 5° from corrected 3D values (Budge et al. 2011). Similarly, Bryce et al. demonstrated that scapular orientation alone can substantially influence version measurements on axial imaging (Bryce et al. 2010). These discrepancies highlight the potential for clinically meaningful measurement errors when relying on 2D imaging alone.
Three-dimensional CT-based preoperative planning has markedly improved the precision of glenoid component placement in rTSA. Modern templating software enables surgeons to simulate various implant positions and optimize baseplate fixation, improving implant alignment and reducing variability in positioning (Budge et al. 2011). Commercially available planning platforms such as BluePrint (Stryker), Exactech GPS, and others use automated algorithms to define scapular reference planes and calculate glenoid version and inclination, though these platforms may employ different methodologies, such as circle-of-best-fit or Friedman-line methods, and have been shown to produce variable measurements when compared with one another (Erickson et al. 2021). Erickson et al. compared four commercial software platforms and found significant differences in version, inclination, and subluxation measurements, with software tending to report greater retroversion and superior inclination than surgeon measurements (Erickson et al. 2021). Achieving accurate version, inclination, and fixation angles remains essential for reducing the risk of mechanical complications and ensuring long-term implant stability.
A central challenge in rTSA for RCA is the accurate placement and orientation of the glenoid baseplate on a glenoid surface that has undergone asymmetric erosion from chronic superior humeral head migration. In RCA, the primary issue is both the orientation and the fixation of the glenoid component: abnormal superior and posterior wear patterns alter the native glenoid geometry, making it difficult to achieve optimal baseplate version and inclination, while simultaneously compromising the bone stock available for secure fixation (Ozel et al. 2020; Lo et al. 2021; Sharifi et al. 2020). These two problems are interrelated, as correcting orientation through excessive reaming may further reduce already-deficient bone stock, potentially compromising fixation (Lo et al. 2021). Navigation and patient-specific instrumentation technologies have been developed to address the orientation challenge (Lee et al. 2020; Kida et al. 2022). Navigation-assisted rTSA has been shown to improve the precision of baseplate version and inclination compared with conventional instrumentation, and a recent systematic review and meta-analysis demonstrated that navigation significantly reduces deviation from planned baseplate inclination (Lee et al. 2020; Kida et al. 2022; Velasquez Garcia et al. 2023). However, navigation primarily addresses the execution of a preoperative plan; it does not resolve the fundamental challenge of accurately characterizing the three-dimensional glenoid morphology upon which that plan is based. If the preoperative assessment of glenoid geometry is incomplete or inaccurate, as may occur when relying on global measurements that fail to capture regional variation, even a precisely navigated procedure may result in suboptimal component positioning (Kida et al. 2022).
The differences between 2D, 3D digital, and 3D physical (printed) morphologic assessments are clinically relevant. Two-dimensional CT measurements are obtained from single axial slices and are susceptible to errors introduced by scapular orientation and slice selection, with studies demonstrating that 2D measurements can differ from corrected 3D values by more than 5° in nearly half of cases (Hoenecke et al. 2010). Three-dimensional digital reconstructions correct for scapular orientation and provide volumetric assessment of the entire glenoid surface, improving inter-rater agreement and measurement reliability (Kubicka et al. 2016; Scalise et al. 2008). However, digital reconstructions are limited to on-screen visualization and may not fully convey the tactile appreciation of articular surface irregularities, depth of erosion, or osteophyte morphology (Lo et al. 2021). Three-dimensional printed models bridge this gap by providing a physical, full-scale replica that allows surgeons to directly inspect and palpate the glenoid surface, which has been shown to improve appreciation of bony morphology compared with CT images alone, particularly in cases of greater morphologic complexity (Scalise et al. 2008). When incomplete morphology data from any of these modalities is used for rTSA planning, the consequences may include inaccurate baseplate version or inclination, suboptimal screw trajectory planning, and inadequate appreciation of regional bone deficiency, all of which can compromise fixation and long-term implant stability.
Beyond virtual preoperative planning, 3D printing provides the ability to generate tangible, patient-specific glenoid models directly from CT data (Wang et al. 2019). This technology converts digital imaging into anatomically precise, full-scale reconstructions, providing surgeons with a tactile understanding of patient-specific bony morphology that cannot be replicated by on-screen visualization alone. Wang et al. demonstrated that 3D-printed models enabled shoulder surgeons to appreciate glenoid bony morphology more clearly compared to review of CT images or humerus-subtracted volume renderings (p = 0.009), and that model usefulness increased with morphologic complexity (Spearman’s ρ = 0.73, p = 0.011) (Wang et al. 2019). These models can reveal structural abnormalities, including osteophyte formation, posterior thinning, and biconcavity, that may not be readily apparent on CT scans, potentially influencing surgical planning and implant selection (Sheth et al. 2015).
However, the accuracy of measurements obtained from 3D-printed models compared with those from CT-based digital planning software has not been well established, particularly in the setting of RCA where asymmetric glenoid erosion is common. Furthermore, traditional global measurements of glenoid version and inclination may not adequately characterize the regional variation in glenoid morphology that occurs with superior humeral head migration and asymmetric wear. Boileau et al. introduced the reverse shoulder arthroplasty (RSA) angle, demonstrating that the inclination of the inferior glenoid, where the baseplate rests, differs significantly from global glenoid inclination, with the TSA angle underestimating superior orientation by an average of 10° (Boileau et al. 2019). This concept of regional variation in glenoid geometry has important implications for baseplate positioning but has not been systematically evaluated across all quadrants of the glenoid face.
The purpose of the present study is to compare version and inclination measurements of 3D-printed glenoid models with their corresponding CT-based digital reconstructions in patients with RCA, and to evaluate regional variation in glenoid morphology across four discrete quadrants. We hypothesize that 3D-printed models will demonstrate strong agreement with CT-based measurements of glenoid version and inclination, while quadrant-level analysis will reveal regional variation in glenoid geometry not captured by global measurements.
METHODS
Study Design and Patient Selection
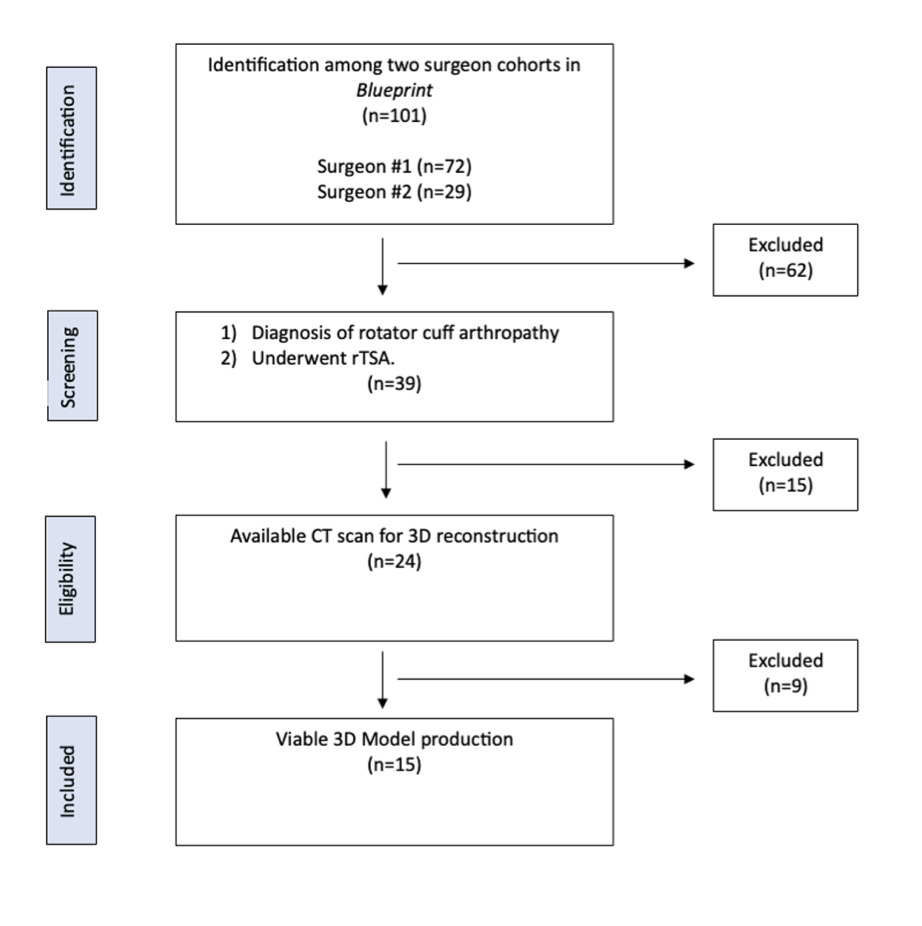
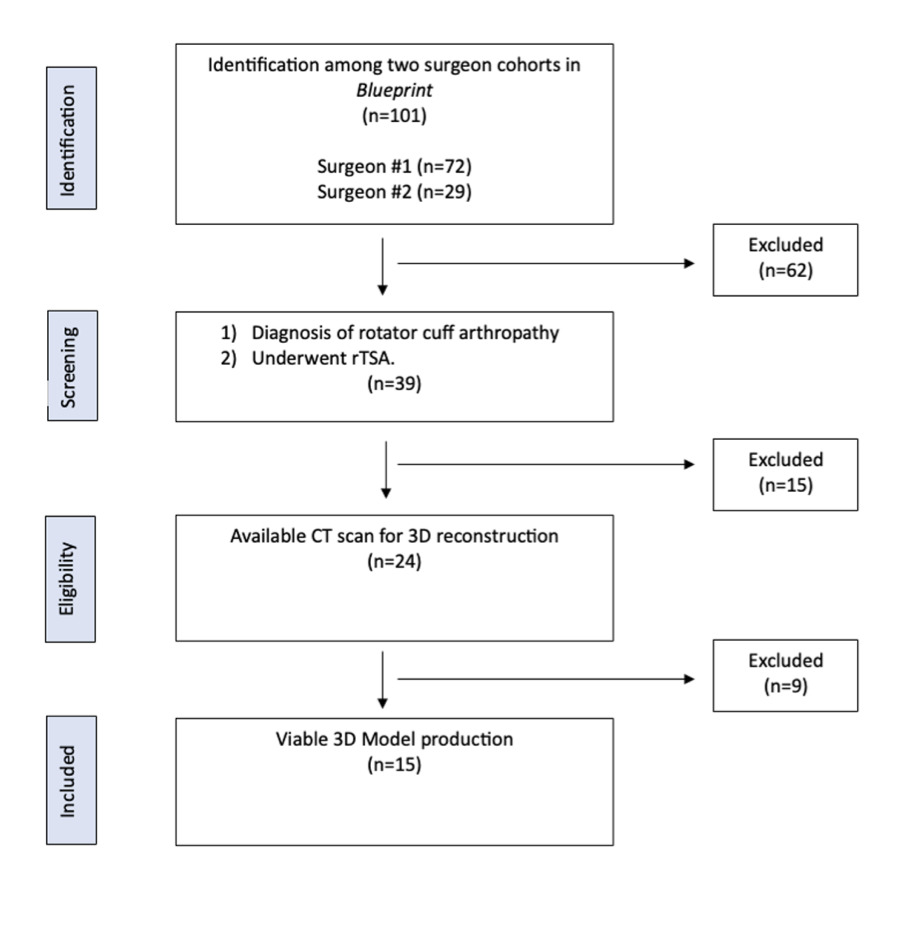
Institutional review board approval (IRB #00004734) was obtained for this retrospective study. Using a commercially available 3D planning software program (BluePrint, Stryker, Kalamazoo, MI, USA), 39 patients with RCA and no previous ipsilateral shoulder operations who underwent primary rTSA by two fellowship-trained orthopedic shoulder and elbow surgeons between August 2019 and June 2022 were identified.
3D Model Generation
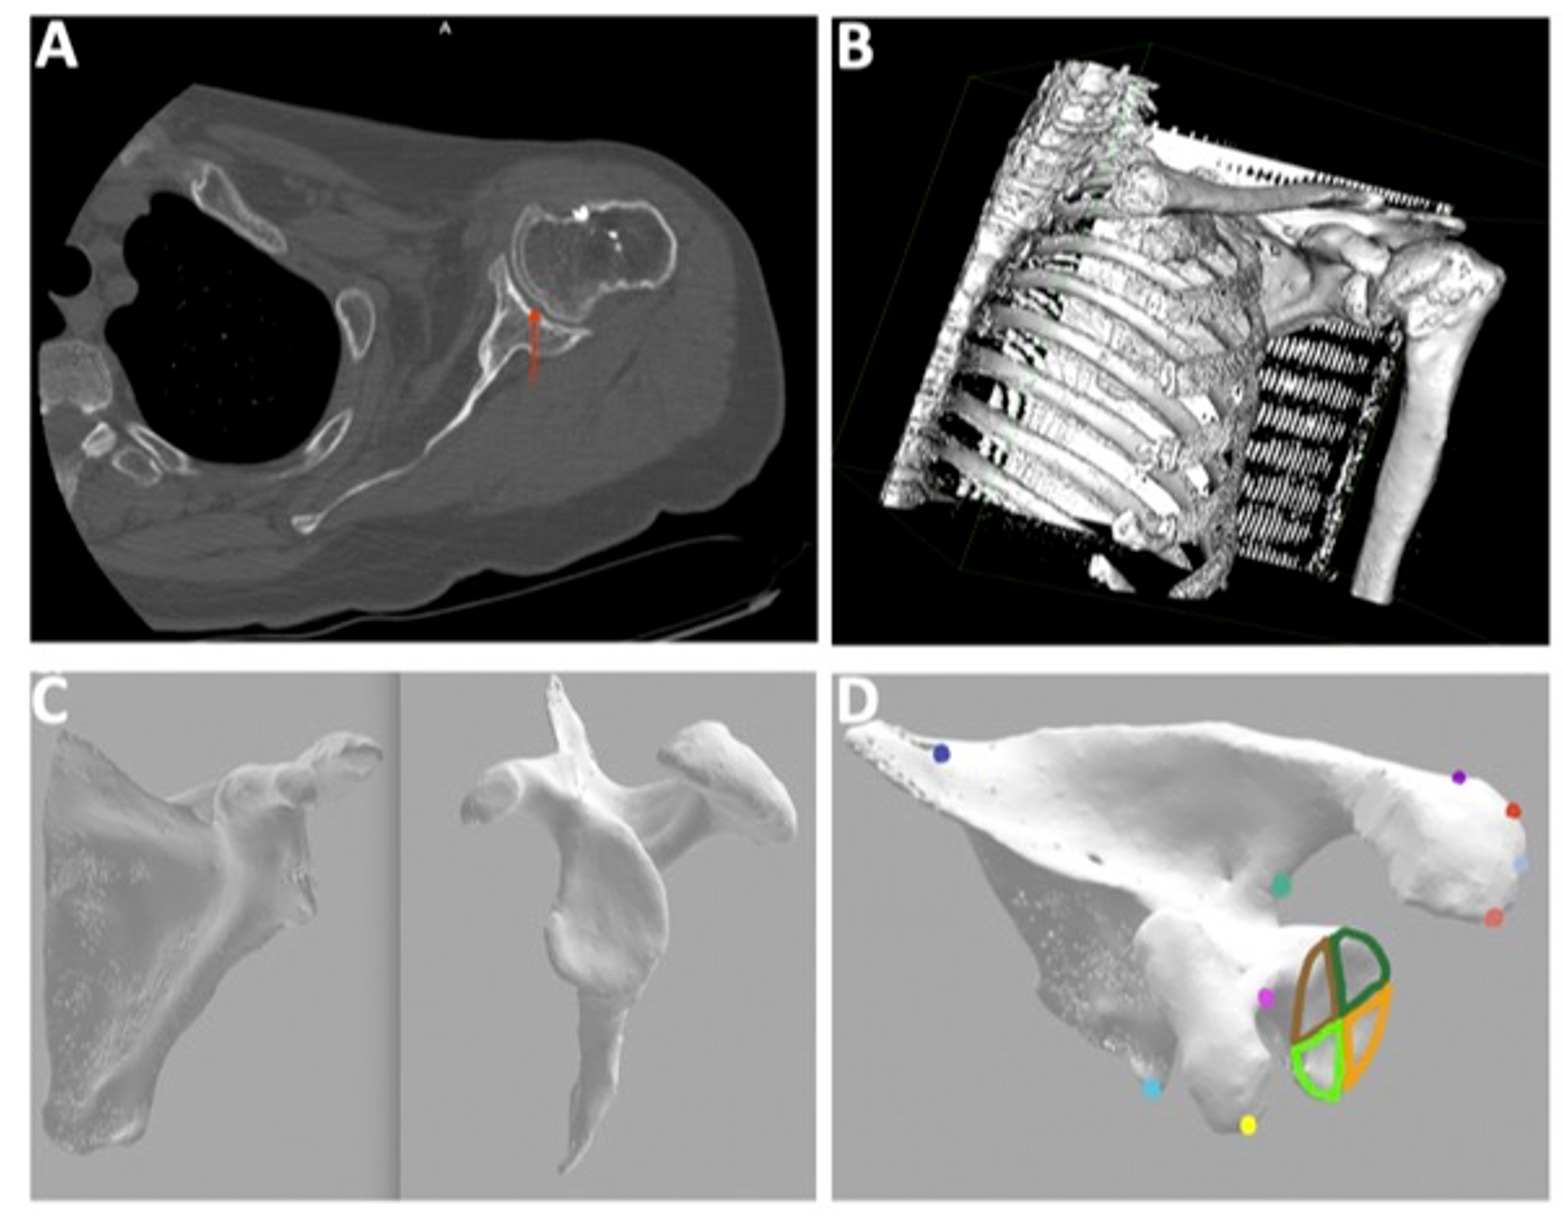
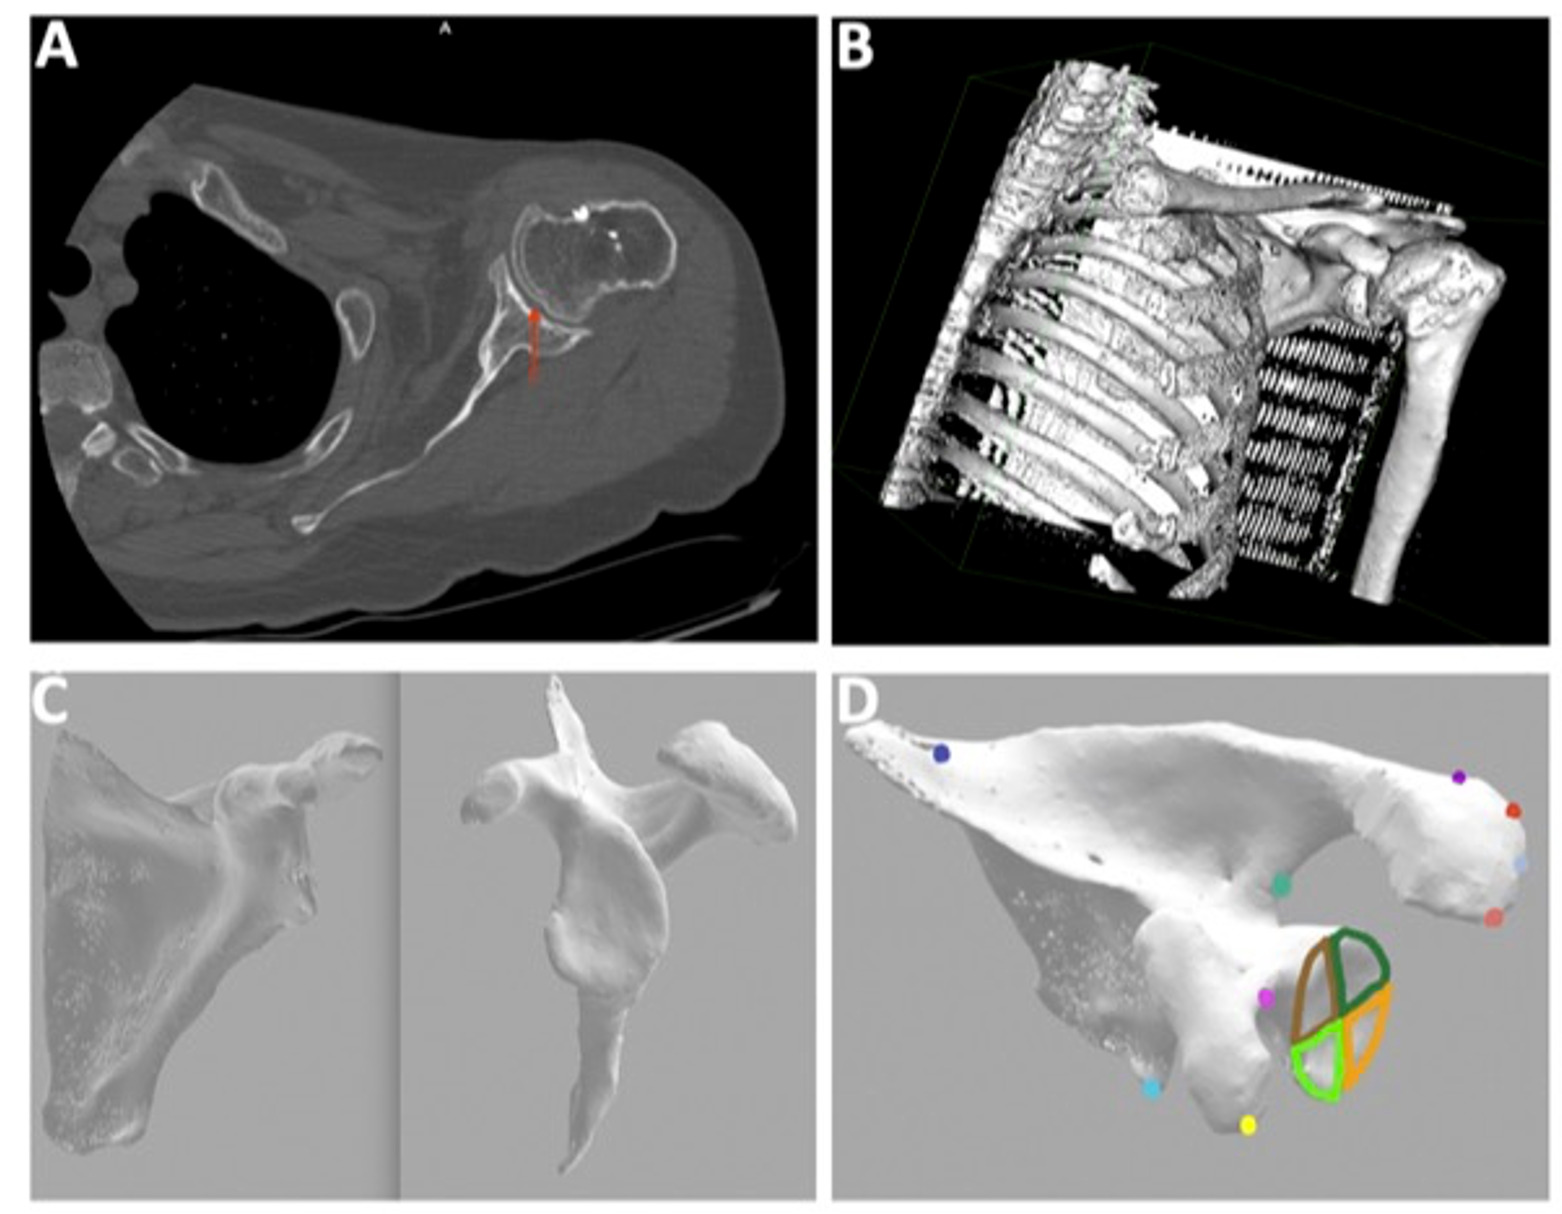
Preoperative shoulder CT scans were uploaded to OsiriX (Pixmeo, Geneva, Switzerland), an open-source DICOM viewer, which converted two-dimensional axial images to 3D digital surface reconstructions. Fifteen patients were excluded due to CT scan image quality, and of the remaining 24 reconstructions processed in Blender (Blender Foundation, Amsterdam, Netherlands), a free and open-source 3D computer graphics software, nine were excluded because the final rendering of the glenoid and scapula did not meet quality thresholds for 3D printing (defined as: incomplete surface meshes with >10% of the articular surface area absent, loss of articular surface contour detail preventing reliable landmark identification, or excessive imaging artifact resulting in non-anatomic surface irregularities that could not be distinguished from true morphology). A total of 15 glenohumeral joint anatomic models were successfully created using a consumer-grade 3D printer (Qidi Plus, Zhejiang, China) (Figure 1).
3D-Printed Scapula Measurements
Anatomic landmarks were manually recorded on each 3D-printed model using a MicroScribe MUS 7.0 digitizing system (GoMeasure3D, Amherst, VA, USA). The MicroScribe is a contact-based 3D digitizer arm that records the spatial coordinates (x, y, z) of each point touched by the stylus tip. Landmarks digitized included the inferior and superior scapular margins, base and tip of the coracoid, base and tip of the acromion, lateral aspect of the acromion, and glenoid center and perimeter. The glenoid center was defined as the geometric centroid of the digitized glenoid perimeter points.
MATLAB R2018B (MathWorks, Natick, MA, USA) was used to calculate glenoid version and inclination from the digitized landmark coordinates. A scapular coordinate system was established using the digitized scapular body landmarks, consistent with previously described methods (Boileau et al. 2018). Glenoid version was defined as the angle between the glenoid face and the transverse axis of the scapula in the axial plane. Glenoid inclination was defined as the angle between the glenoid face and the line perpendicular to the supraspinatus fossa floor in the coronal plane. Positive values indicated retroversion and superior inclination; negative values indicated anteversion and inferior inclination.
Quadrant Analysis
The glenoid face was divided into four quadrants by bisecting the glenoid along its superoinferior axis and anteroposterior axis through the geometric center, creating anterosuperior, anteroinferior, posterosuperior, and posteroinferior quadrants. Version and inclination were calculated independently for each quadrant by fitting a plane to the digitized perimeter and surface points within each region and measuring the orientation of that plane relative to the scapular coordinate system.
Osteophytes were included in the glenoid perimeter measurements when they were contiguous with the articular surface and could not be reliably distinguished from the native glenoid rim on the 3D-printed model. No attempt was made to digitally remove osteophytes prior to measurement, as this would introduce subjective judgment and the clinical goal was to characterize the morphology as it would be encountered intraoperatively.
The complete workflow from CT acquisition to quadrant-level measurement is illustrated in Figure 2.
BluePrint Measurements
BluePrint software (Stryker) independently measured glenoid version and inclination for each patient using its proprietary automated algorithm, which defines the scapular plane based on anatomic landmarks and calculates version and inclination relative to this reference frame. BluePrint uses a best-fit method to define the glenoid articular surface. These measurements served as the basis of comparison for the 3D-printed model measurements. It should be noted that the BluePrint algorithm and the MATLAB-based method used for the 3D-printed models employ different reference systems and computational approaches, which may contribute to systematic differences between the two measurement sets.
Measurement Reliability
All MicroScribe measurements were performed by a single trained operator using a standardized landmark acquisition protocol. Intra-rater reliability was not formally assessed in this study, which represents a limitation. However, the MicroScribe digitizer has demonstrated acceptable precision for anatomic landmark acquisition in prior validation studies, with mean absolute errors of less than 0.4 mm for 3D-printed models (Olszewski et al. 2014).
Statistical Analysis
A Shapiro-Wilk test was performed to evaluate normal distribution of the data. Mean and standard deviation were calculated for glenoid version and inclination for the entire glenoid and each of the four quadrants. To assess agreement between 3D-printed model and BluePrint measurements, both Pearson correlation coefficients and Bland–Altman analysis were performed. Pearson correlation coefficients described the strength of the linear relationship between the two methods, with r = 0.80–1.0 indicating a strong positive association. Bland–Altman analysis was used to evaluate the mean bias (average difference) and 95% limits of agreement (mean difference ± 1.96 SD) between the two measurement methods, as correlation alone does not demonstrate agreement and two methods may correlate strongly while exhibiting clinically meaningful systematic bias (Reid et al. 2022). Paired t-tests were used to compare mean version and inclination between the 3D-printed models and BluePrint. One-way repeated measures ANOVA was used to compare version and inclination across the four glenoid quadrants. P values < 0.05 were considered statistically significant. All statistical analyses were performed using Microsoft excel with the Real Statistics Resource Pack add-in (Release 8.9, Charles Zaiontz), which provides functions for Bland–Altman analysis, Shapiro-Wilk testing, and repeated measures ANOVA.
Throughout this manuscript, the terms “correlation,” “agreement,” and “validation” are used with the following distinctions: “correlation” refers to the strength and direction of the linear relationship between two sets of measurements (Pearson r); “agreement” refers to the degree to which two methods produce interchangeable results, assessed by Bland–Altman analysis; and “validation” refers to the broader process of determining whether the 3D-printed model measurement method produces clinically acceptable results when compared with an established reference method. No formal sample size or power calculation was performed for this study, which is acknowledged as a limitation.
RESULTS
Patient Demographics
The cohort consisted of 53.33% (n = 8) females, with a mean age of 66.2 ± 12.6 years, mean BMI of 26.8 ± 5.25, and 46.67% (n = 7) previous smokers (Table 1).
Exclusions
Of the original 39 patients screened, 15 were excluded because the CT scan image density was less than 200 Hounsfield units, resulting in undiscernible glenoid and humeral head articular surfaces that precluded accurate segmentation. Of the remaining 24 reconstructions processed in Blender, nine were excluded because the final rendering did not meet quality thresholds for 3D printing. A total of 15 patients (38%) were included in the final analysis (Figure 1).
Overall Glenoid Version and Inclination
The mean glenoid version of the 3D-printed models was 16.22° ± 11.26° and the mean glenoid inclination was 8.91° ± 7.26°. The mean glenoid version from BluePrint was 11.80° ± 11.40° (p = 0.295) and the mean glenoid inclination was 7.53° ± 8.77° (p = 0.642). Although the 3D-printed models measured a mean of 4.42° greater retroversion than BluePrint, this difference did not reach statistical significance. There were strong, statistically significant correlations between 3D-printed model and BluePrint measurements for both glenoid version (r = 0.95, p 0.001) and glenoid inclination (r = 0.89, p 0.001) (Table 2).
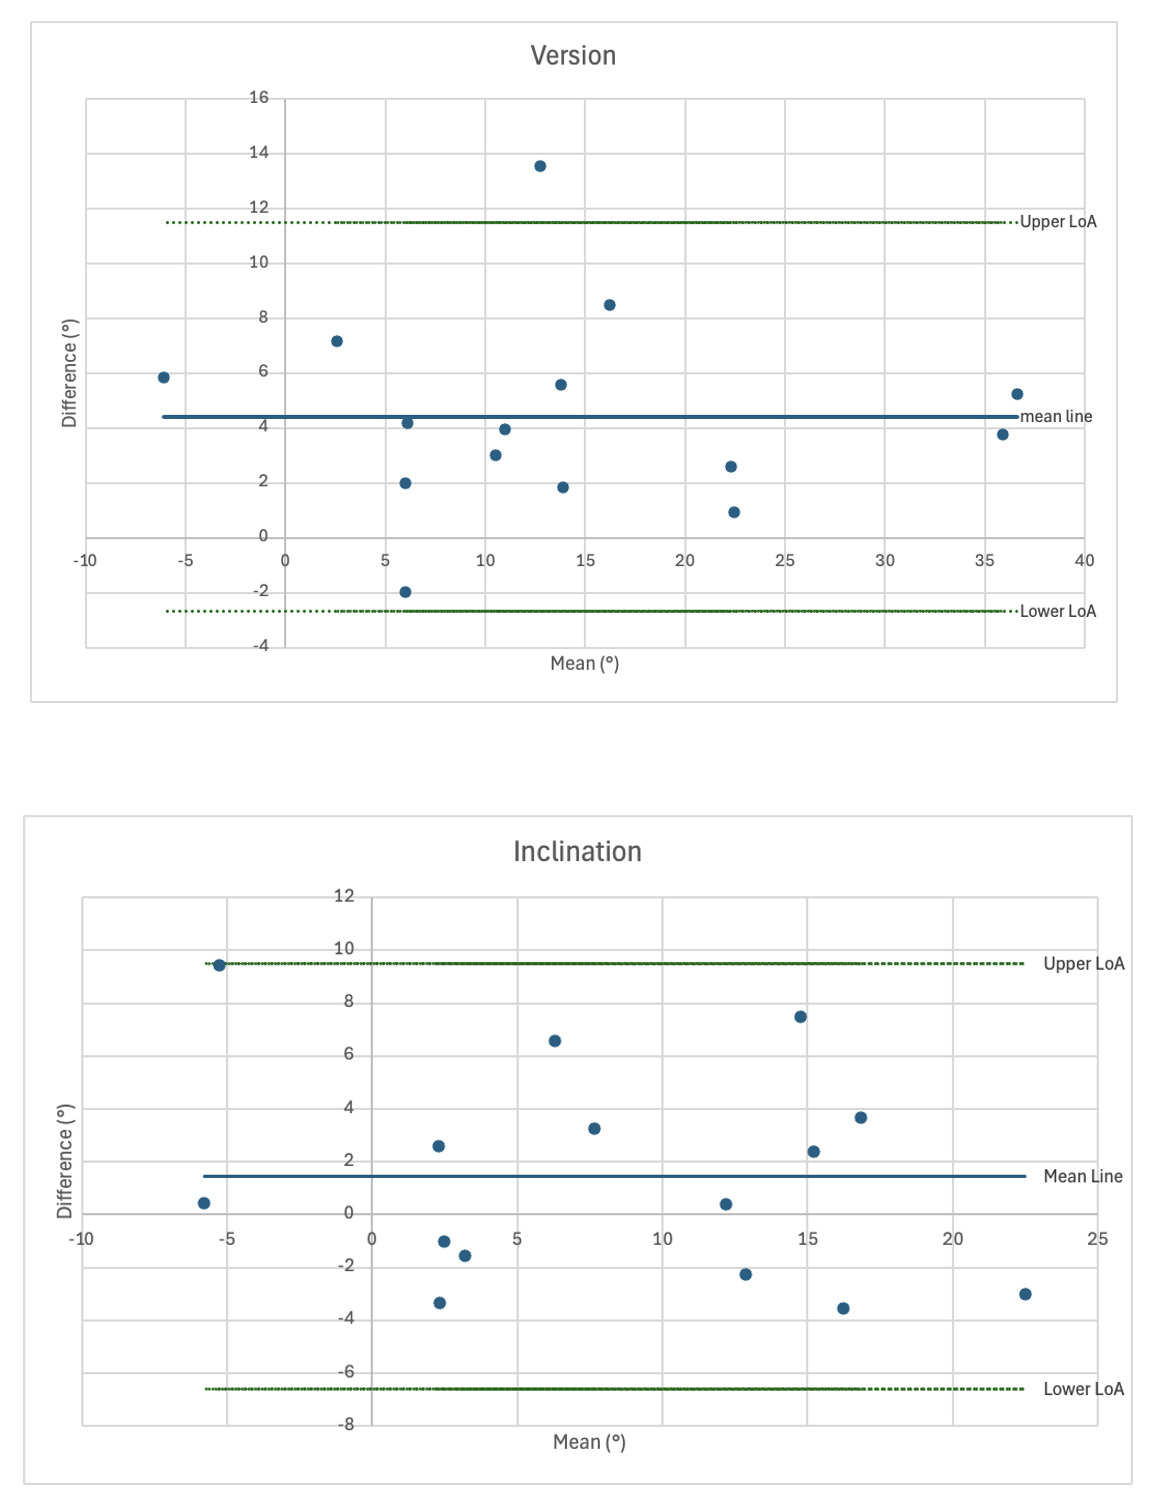
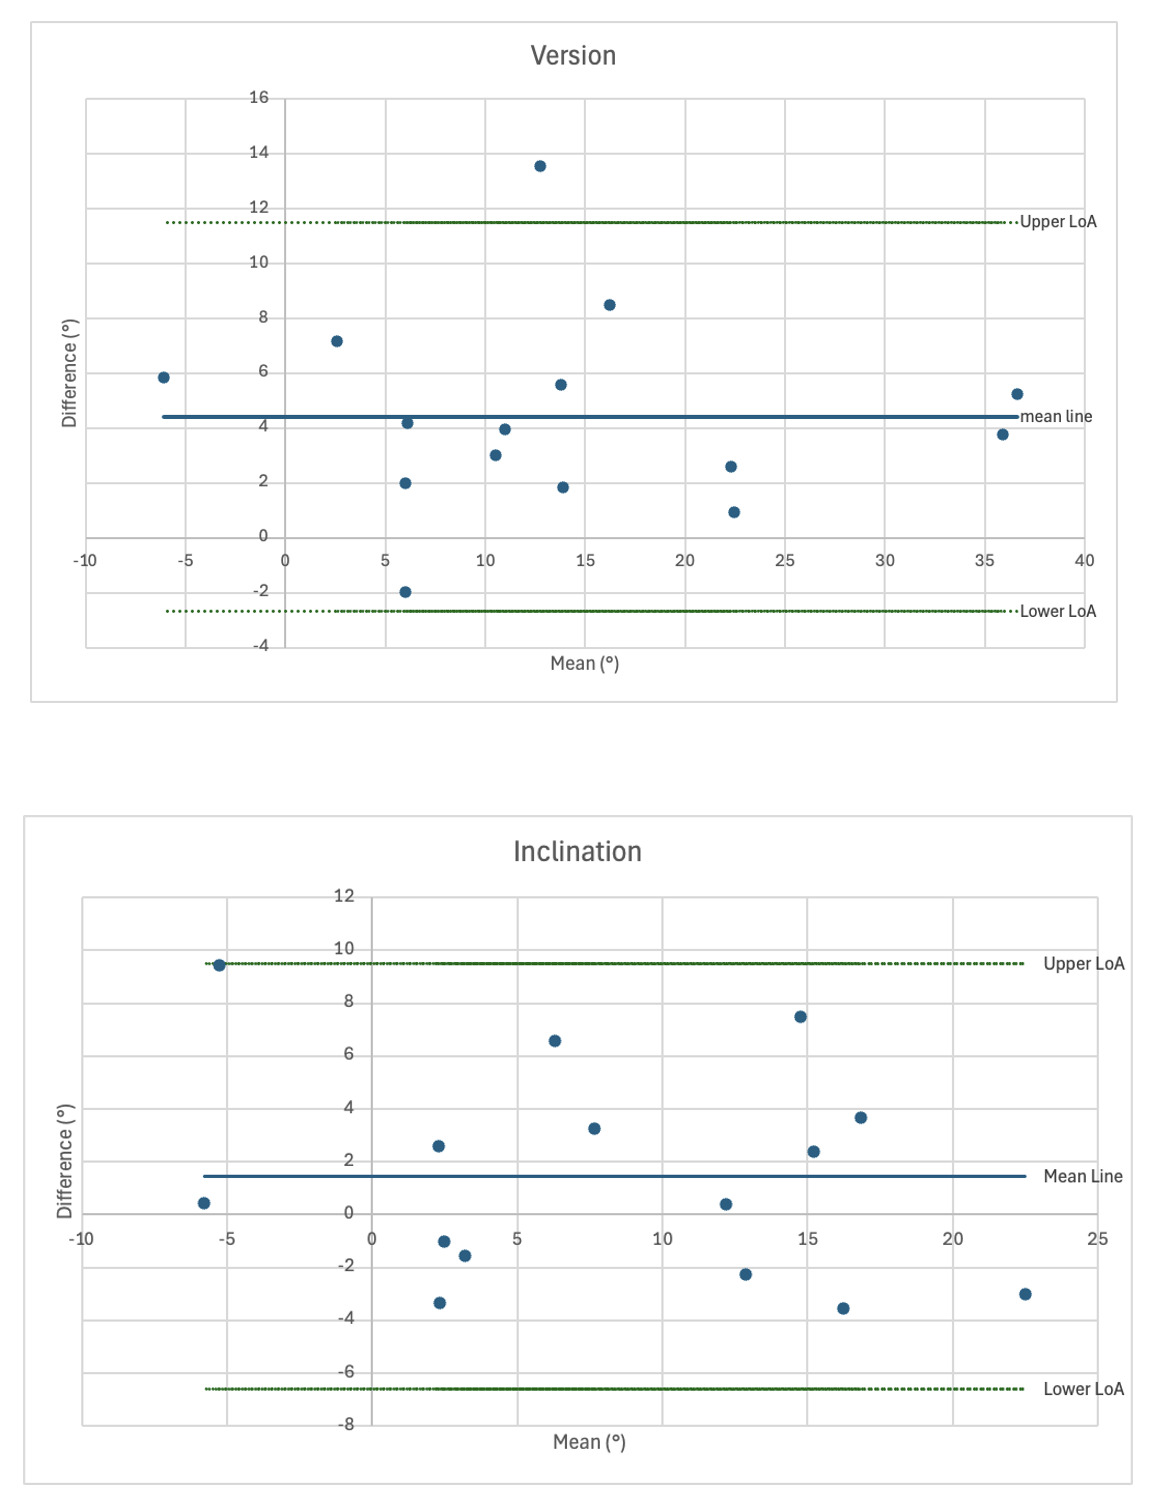
Bland–Altman analysis for glenoid version demonstrated a mean bias of 4.41° (3D-printed model more retroverted than BluePrint), with 95% limits of agreement ranging from −2.67° to 11.5°. For glenoid inclination, the mean bias was 1.43°, with 95% limits of agreement ranging from −6.62° to 9.48° (Figure 3).
Quadrant Analysis
Glenoid version did not vary significantly across the four quadrants (anteroinferior 20.75° ± 10.85°, anterosuperior 18.63° ± 10.28°, posteroinferior 9.29° ± 19.33°, posterosuperior 15.95° ± 14.38°; p = 0.148). Glenoid inclination varied significantly across the four quadrants (anteroinferior 23.92° ± 9.01°, anterosuperior −4.15° ± 8.26°, posteroinferior 19.82° ± 9.07°, posterosuperior −5.99° ± 9.82°; p 0.001) (Table 3). The inferior quadrants demonstrated superior inclination (mean 21.87°), while the superior quadrants demonstrated inferior inclination (mean −5.07°), indicating a divergent tilt pattern across the superoinferior axis.
DISCUSSION
In this study, glenoid version and inclination measured on 3D-printed glenoid models in patients with rotator cuff arthropathy demonstrated strong agreement with measurements obtained from CT-based 3D preoperative planning software (r = 0.95 for version, r = 0.89 for inclination), supporting the validity of 3D-printed models for evaluating glenoid morphology in this patient population. Additionally, quadrant-level analysis of version and inclination revealed significant regional variation in inclination that is not captured by traditional global measurements of the glenoid face.
The strong agreement between 3D-printed model and BluePrint measurements observed in this study is consistent with prior work validating 3D measurement techniques against established methods. Boileau et al. demonstrated that automated 3D software measurements of glenoid version showed concordance correlation coefficients of 0.93–0.95 when compared with established manual methods (Boileau et al. 2019). The slightly greater retroversion measured on 3D-printed models compared with BluePrint (mean difference 4.42°) is consistent with the findings of Reid et al., who demonstrated that 3D version measurements were significantly more retroverted than 2D measurements in 73% of cases, with discrepancies exceeding 10° in 14% of shoulders (Reid et al. 2022). Importantly, Reid et al. proposed that localized glenoid topography, particularly peripheral osteophytes and irregular articular boundaries, was a primary contributor to measurement variability, as inclusion or exclusion of non-articular bone substantially altered measured version in high-discrepancy cases (Reid et al. 2022). This observation is particularly relevant to the present study, as osteophytes were included in the glenoid perimeter measurements on 3D-printed models, which may account for some of the systematic difference between the two measurement methods.
The Bland–Altman analysis provides additional insight beyond correlation. While the Pearson correlation coefficients were strong (r = 0.95 for version, r = 0.89 for inclination), the Bland–Altman analysis revealed a systematic mean bias of 4.41° for version, indicating that 3D-printed models consistently measured greater retroversion than BluePrint. The 95% limits of agreement for version (-2.67° to 11.5°) indicate that individual measurements could differ by up to approximately 14° between the two methods. For inclination, the mean bias was smaller (1.43°), with 95% limits of agreement of −6.62° to 9.48°. These findings underscore that strong correlation does not necessarily imply interchangeability, and clinicians should be aware of this systematic bias when interpreting 3D-printed model measurements.
The clinical relevance of the observed 4.42° mean version discrepancy warrants careful consideration. In the context of rTSA, the clinical significance of glenoid version error depends on the implant design and the overall combined version of the glenoid and humeral components. Contemporary evidence suggests a functional “safe window” of approximately 0°–20° of combined component retroversion in rTSA, and clinical studies have not consistently demonstrated associations between residual glenoid retroversion and patient-reported outcomes, range of motion, or complication rates when key biomechanical parameters are maintained (Koutp et al. 2026). Elmallah et al. found no significant differences in functional outcomes, range of motion, or complications between patients with baseplate retroversion ≤15° versus >15° (Elmallah et al. 2022). However, for inclination, even small errors may be more consequential: superior inclination of the glenoid component has been associated with increased rates of scapular notching and baseplate loosening (Lopiz et al. 2021). Therefore, while a 4.42° version discrepancy may fall within a clinically tolerable range for many patients, the wider limits of agreement (up to 14°) suggest that individual cases could exceed clinically meaningful thresholds, and surgeons should exercise caution when using 3D-printed model measurements for precise version planning.
The discrepancy between measurement modalities also reflects the different computational approaches used by BluePrint and the MATLAB-based method. BluePrint employs a proprietary automated algorithm with a best-fit approach to define the glenoid articular surface, whereas the MATLAB method relies on manually digitized landmarks and perimeter points. Erickson et al. compared four commercial software platforms and found significant differences in version, inclination, and subluxation measurements, with Blueprint producing significantly different version measurements than surgeon measurements (p = 0.02) (Erickson et al. 2021). These findings underscore that measurement methodology itself introduces variability, and clinicians should be aware that different planning systems may yield different values for the same glenoid.
A novel contribution of the present study is the identification of significant regional variation in glenoid inclination across the four quadrants of the glenoid face. While glenoid version remained relatively consistent across quadrants, inclination differed markedly: the inferior quadrants demonstrated superior inclination (mean 21.87°), whereas the superior quadrants demonstrated inferior inclination (mean −5.07°). This pattern suggests that in patients with RCA, the humeral head erodes deeply into the superior glenoid, creating a concave, “cliff-like” configuration rather than uniform circumferential wear along the superior glenoid rim. This finding is conceptually consistent with the work of Boileau et al., who introduced the RSA angle and demonstrated that the inclination of the inferior glenoid, where the baseplate rests, is on average 10° greater than the global glenoid inclination (TSA angle), regardless of measurement method or erosion type (Boileau et al. 2019).The present study extends this concept by demonstrating that inclination varies not only between the superior and inferior halves of the glenoid but also across all four quadrants, providing a more granular characterization of the erosion pattern.
Such regional variation in inclination has potential implications for baseplate positioning and fixation in rTSA. If the inferior glenoid is significantly more superiorly inclined than global measurements suggest, surgeons may underestimate the degree of correction needed to achieve neutral baseplate inclination. Avoiding superior inclination of the glenoid component is critical, as it has been associated with increased rates of scapular notching, baseplate loosening, and inferior clinical outcomes (Mahendraraj et al. 2021). The quadrant-level data presented here may assist surgeons in anticipating asymmetric deformity and planning appropriate correction, particularly in the setting of advanced superior bone loss.
As shoulder arthroplasty continues to evolve toward patient-specific planning and the use of augmented components, a more detailed understanding of glenoid morphology may become increasingly valuable. Wang et al. demonstrated that 3D-printed models were rated as more useful by surgeons as glenoid complexity increased, suggesting that physical models may be most beneficial in precisely the cases where regional morphologic variation is greatest (Wang et al. 2019). In this context, 3D-printed models may complement digital planning by allowing tactile assessment of articular boundaries and depth of erosion that may be less apparent on virtual reconstructions alone.
Several limitations should be acknowledged. First, the exclusion of 24 of 39 patients (62%) due to inadequate CT-to-model conversion represents a significant limitation and may introduce selection bias, as the included models may represent cases with more favorable imaging characteristics. This high exclusion rate reflects the limitations of using open-source, non-proprietary software for CT-to-model conversion rather than a limitation of the CT scans themselves, which were all of sufficient quality for BluePrint analysis. The multi-step conversion process (DICOM → OsiriX → Blender → 3D printer) introduces potential for data loss at each stage, particularly in cases with low bone density, thin cortical surfaces, or significant osteophyte formation that complicates segmentation boundaries. It is possible that the excluded patients differed systematically from the included cohort. For example, patients with lower bone density, more severe erosion, or more complex osteophyte morphology may have been disproportionately excluded, potentially biasing the included sample toward cases with more favorable anatomy. This limits the external validity of the findings, as the agreement observed between 3D-printed models and BluePrint may not generalize to the full spectrum of RCA morphology. Future studies should evaluate whether proprietary CT-to-print workflows or dedicated segmentation software yield higher conversion rates and whether the agreement observed in this study is maintained across a broader range of glenoid morphologies.
Second, manual digitization of anatomic landmarks introduces the potential for measurement error, and intra-rater and inter-rater reliability were not formally assessed. Although a standardized acquisition protocol was used, future studies should include repeated measurements by multiple operators to quantify measurement precision. Although a standardized acquisition protocol was used and the MicroScribe digitizer has demonstrated acceptable precision in prior validation studies (mean absolute errors 0.4 mm),13 the absence of repeated measurements by the same operator or by multiple independent operators prevents quantification of measurement precision in this specific study. Future studies should include repeated measurements by multiple operators to formally assess intra-rater and inter-rater reliability.
Third, osteophytes were included in glenoid perimeter measurements, which may have influenced version and inclination calculations; however, this approach reflects the morphology as encountered intraoperatively. It is plausible that excluding osteophytes would reduce the systematic version bias observed between the 3D-printed models and BluePrint, as BluePrint’s best-fit algorithm may partially exclude or de-emphasize peripheral osteophytes in its surface definition. The effect on regional quadrant measurements is less predictable, as osteophytes in RCA tend to form preferentially along the inferior glenoid rim, which could differentially affect inferior quadrant measurements. Future studies comparing measurements with and without osteophyte removal would help clarify this effect.
Fourth, the relatively small sample size of 15 models limits generalizability and increases susceptibility to outlier influence. Fifth, the measurements were performed on 3D-printed models rather than virtual digital models; future studies should compare measurements obtained from both the virtual reconstruction and the printed model to determine whether the printing process itself introduces dimensional error. No formal a priori sample size or power calculation was performed. Given the small final sample size (n = 15), the study may have been underpowered to detect clinically meaningful differences between the two measurement methods. Finally, this study focused on morphologic analysis and did not evaluate clinical outcomes or implant survival; therefore, the clinical implications of regional variation in glenoid inclination should be interpreted cautiously.
CONCLUSION
Glenoid version and inclination measured on 3D-printed models correlate strongly with measurements obtained from CT-based preoperative planning software in patients with rotator cuff arthropathy. Significant regional variation in glenoid inclination across quadrants, with inferior quadrants demonstrating superior inclination and superior quadrants demonstrating inferior inclination, suggests that global measurements may not fully characterize the asymmetric erosion patterns encountered in RCA. These findings support the potential utility of 3D-printed models and quadrant-level analysis for preoperative assessment, though further studies with larger sample sizes, formal reliability testing, and clinical outcome correlation are needed.