


Introduction
Increase in demand for total knee arthroplasty (TKA) over the last decades (El Bitar et al. 2015; Pabinger, Lothaller, and Geissler 2015) as well as increase of the associated costs and pressures on medical resources and staff has led efforts to optimize postoperative protocols, including reduction of hospital stays, while preserving quality of care. Remote patient monitoring, through a variety of wearable devices and connected patient engagement platforms, provides clinicians with additional visibility to patients’ recovery. These systems allow collection of patient recovery data during patient day-to-day activity, at higher granularity and reduce staff costs than can be achieved traditionally (e.g., Gurchiek et al. 2021). Because of the high granularity of the data collected, complications and deviations from the expected recovery path can potentially be detected earlier than with practice visits alone, allowing clinicians to manage patients by exception rather than following a standardized trajectory for all patients. In addition, remote patient monitoring can be particularly valuable in conditions such as the recent COVID-19 pandemic, enabling continued patient monitoring while limiting potential disease-transmitting contacts (e.g., Glinkowski 2022; Haider et al. 2022; Muller et al. 2022).
Although the advantages of remote patient monitoring are a strong driver for its development, the potentially large data volumes generated may increase the demand for clinical staff resources to process and derive insights and/or clinical actions from it. While clinical staff generally holds positive views of remote patient monitoring, insufficient resources have been reported as one of the reasons for concern in adopting these technologies (Davis et al. 2014). Moreover, increasing reports about clinical staff burnout (Martinelli et al 2020; Travers 2020) and health workforce shortages (Drennan and Ross 2019; Oslock et al. 2022) may further raise concerns about the additional demand from clinical staff to monitor increasing volumes of patient data.
The potential increased demand for data interpretation by clinical staff may be ameliorated by using machine learning techniques that support clinical decisions driven by patient data (e.g., Misic and Zdravkovic 2022). In the context of remote patient monitoring, these techniques can be used to appropriately summarize the state of a patient from multiple data streams and assess against normative models of recovery. Significant deviations from these models can be automatically brought to the attention of clinical staff through electronic alerts warranting a further, more detailed assessment by the clinical staff. Electronic alerts have been successfully used in fields of surgery including cardiac and gastrointestinal (Symer et al. 2017). For example, alerts resulting from remote postoperative monitoring have shown to reduce the number of potentially avoidable urgent care visits in ambulatory cancer surgery patients (Simon et al 2021).
Following total knee arthroplasty, pain is anticipated and appropriate pain management indicated, with 60% of patients experiencing severe postoperative pain and 30% moderate pain (Seo et al. 2017). Postoperative pain inhibits early ambulation and range of motion, increasing the risks of thromboembolism and impacting rehabilitation, patient satisfaction, and overall outcomes (Jing-wen, Ye-shuo, and Liang-kun 2019). Moreover, pain can also be a symptom of major complications in the early postoperative phase, such as vascular and peripheral nerve injuries, periprosthetic fractures and infection and dislocations (Pulido et al. 2008). Monitoring patients’ pain levels is therefore an important aspect of TKA patient recovery monitoring for assessing pain management effectiveness. Despite its clinical value, however, assessing pain remains highly subjective, as pain can only be tracked through patient self-assessment reports. The latter are increasingly collected remotely through digital applications (Lalloo et al. 2017; Zhao et al. 2019).
Even though the building blocks for remote pain monitoring are now available through various platforms, a framework for processing and informing clinical decisions is still lacking. To that extent, this paper presents a statistical recovery model for TKA patients based on remotely collected pain scores along with a decision framework that allows for the identification of patients reporting pain scores with a low probability to issue electronic alerts that, in turn, have the potential to unlock clinical decisions.

Methods
Study data
Clinical data was collected through two subsequent studies (study A and B), where patients undergoing primary total knee arthroplasty used the MotionSense wearable sensors along with the MotionSense® mobile application (Stryker, Mahwah, NJ). Through its integration with the HIPAA-compliant OrthoLogIQ® cloud service, the MotionSense system allows for the remote monitoring by clinicians of patients’ range of motion, step count, knee active time, and prescribed exercise completion, as well as pain scores and surveys.
For both studies, patients planning to undergo unilateral primary total knee surgery at one of two practices were prospectively enrolled into the IRB-approved studies following informed consent. Following enrollment in the study, patients underwent unilateral primary TKA by one of two arthroplasty surgeons (RCM and PBJ for study A, PBJ for study B). Inclusion criteria included: patients’ ability to provide consent with an age ranging from 45 to 80 years, a BMI not exceeding 35 kg/m2, ownership of a smartphone (agnostic to brand or type), and lack of severe skin conditions. Patient enrollment and the MotionSense introduction and initial setup occurred with a research nurse during a preoperative visit at the surgeons’ clinic. Patients were requested to use the MotionSense system starting up to four weeks prior to surgery and up to 90 days after surgery. A total of 101 patients were initially enrolled for study A and 20 for study B.
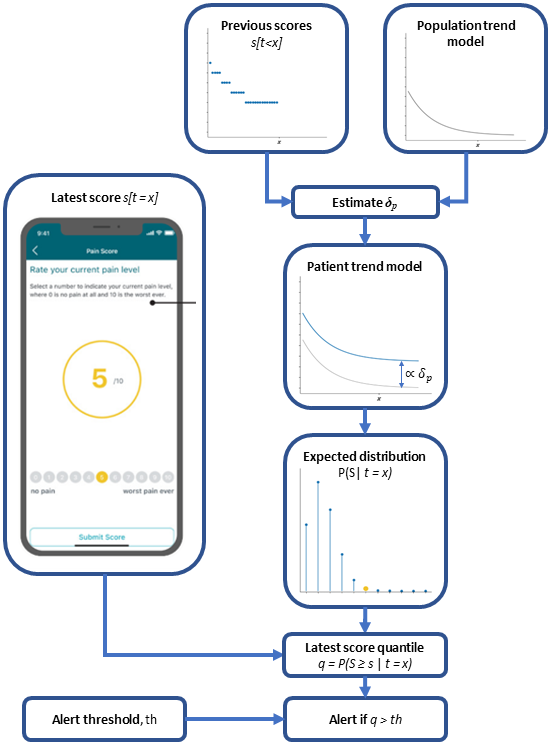
Patients from both studies were prompted daily by the MotionSense mobile application to report pain scores on an 11-point Numerical Rating Scale (NRS; example app screen shown in Figure 1). Scores from patients reporting at least five scores in the 90 days following surgery were used in the remainder of this paper, resulting in a final study cohort of 62 patients (mean age ± SD: 65.3 ± 7.4, 36/26 male/female, mean BMI ± SD: 28.1 ± 4.0) for study A and 17 patients (mean age ± SD: 65.8 ± 4.7, 11/6 male/female, mean BMI ± SD: 28.4 ± 3.1) for study B.

Statistical modelling
Since pain scores in MotionSense and other systems are reported as discrete integer values in an 11-point Numerical Rating Scale (NRS) scale we chose to use a beta-binomial discrete probability distribution as the model response variable:
p(s|\alpha,\beta) = \ \binom{n}{s}\frac{Β(s + \alpha,n - s + \beta)}{Β(\alpha,\beta)}
Β(x,y) = \ \frac{\Gamma(x)\Gamma(y)}{\Gamma(x + y)}
with support where is the gamma function. This discrete value distribution allows to constrain model’s response variable to the non-negative integer domain values of the pain scores by fixing its count parameter n = 10. We also opted for a reparametrized use of beta-binomial distribution by specifying the concentration parameters and as a function of the expected value (mean) and variance :
\alpha = \ \mu \cdot \upsilon\ \text{and}\ \beta = (1 - \mu) \cdot \nu\ \text{with}\ \nu = \ \frac{\mu \cdot (1 - \mu)}{\phi}
Using this parameterization, the mean and variance can be modeled as a function of time since surgery including a random effect for patient corresponding to an offset between the individual patient and population level expectation:
logit(\mu) = \ Z_{\mu}(t) + \ \delta_{p}
and
\phi = \frac{\mu}{\left( 1 + e^{- \left( Z_{\phi}(t) \right)} \right)(1 - \mu)}
and with prior
\delta_{p}\sim\ Normal\ (0,\ \sigma)
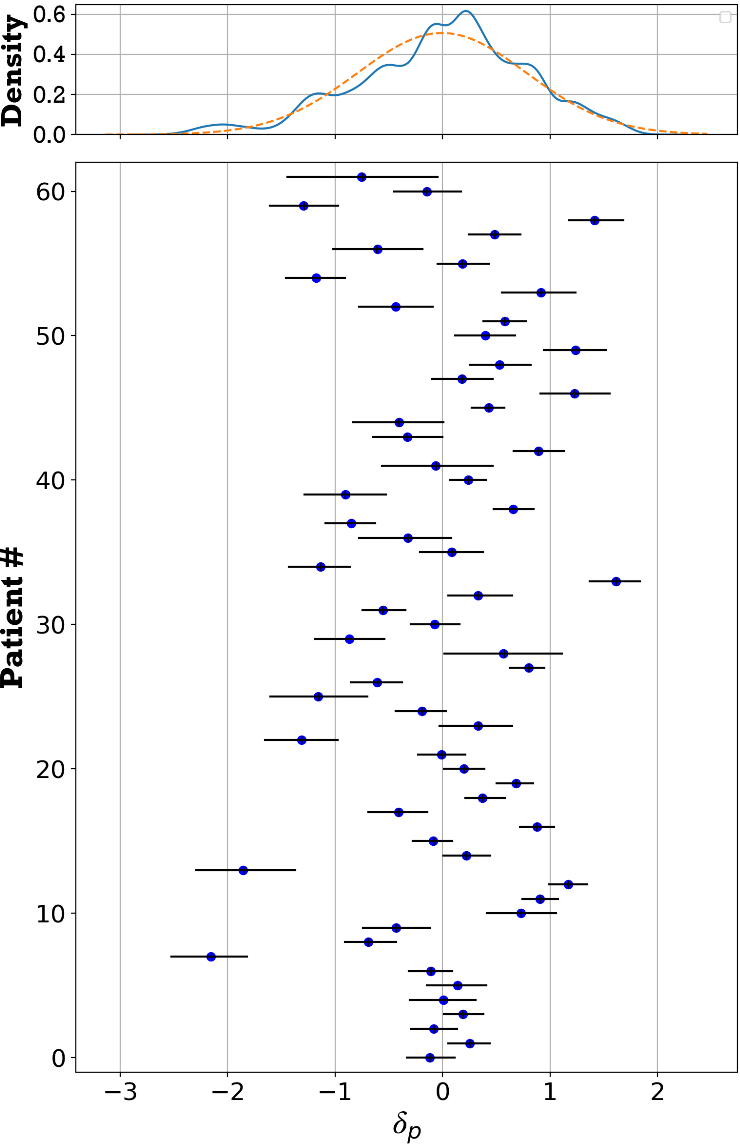
The functions and correspond to a hidden-layer neural network taking the time of pain score report days since surgery) as input. These functions allow modelling of non-linear relationships in both the mean and variance of the pain scores, as a function of days since surgery. Modelling each patient’s as the component of the model parameterizes the distribution of possible values in the population of patients. This standard deviation of this distribution σ, parameterizes the dispersion of values, and is also estimated when fitting the model.
Incremental use case
The desired use case for the model is to enable the assessment of a patient’s latest submitted pain score against a statistical expectation of this pain score (i.e., the model’s estimated probability distribution) on a given recovery day. To calculate this probabilistic expectation, the patient’s specific parameter is required to adjust the population level trend. Each patient’s can be estimated as a latent variable when fitting the model to a pre-existing complete dataset (i.e., all available data for each patient). In a real-world application, we wish to assess new patient scores as they become incrementally available during the patients’ recovery. In this case, it is not efficient to refit the whole dataset every time a new data point is produced. As a more efficient procedure, we propose that for each newly provided patient pain score, only the preceding pain scores (i.e., all previous from the same patient) are used to re-estimate which is then used to calculate the expected pain score distribution and evaluate the probability of the latest score (Figure 1). The idea behind using all scores but the last, is so that, in case the pain score of interest lies at the tails of the distribution, it has less influence on shifting the estimate towards its own value.
Through the aforementioned process, we can derive a prediction for the expected distribution of values for a given time during a patient’s recovery. By itself, this distribution has limited value for a clinician and the added complexity of interpreting a probabilistic density may further burden and preclude untrained staff from using it. The interest of evaluating a given pain score is in enabling a decision about whether some action must be taken with regards to the patient condition or as a way of prioritizing interaction with patients.

In the context of the described model, the evaluation of a given pain score consists of assessing its value against the predicted distribution for the recovery day under consideration. The quantile value (or its inverse, the cumulative distribution function, cdf) can be calculated as a metric representing the likelihood of the reported pain score based on the predicted distribution; a statistic that most clinical staff can understand. This metric can be used by clinicians to issue alerts and bring attention to patients when their reported pain scores are above/below predefined thresholds set in the quantile scale.
Patients from both studies were prompted daily by the MotionSense phone application to report pain scores on an 11-point Likert scale (0-no pain to 10 worst pain ever; example app page shown in Figure 1). Scores from patients reporting at least five scores in the 90 days following surgery were used in the analysis, resulting in a final study cohort consisted of 62 patients (mean age ± SD: 65.3 ± 7.4, 36/26 male/female, mean BMI ± SD: 28.1 ± 4.0) for study A and 17 patients (mean age ± SD: 65.8 ± 4.7, 11/6 male/female, mean BMI ± SD: 28.4 ± 3.1) for study B.
Model fitting and parameter estimation
Study A was used to fit the mean population trend (parameters and in the model) as well as each patient’s Study B was used as an independent validation dataset where only were fitted (the same and from study A model fit were used). This replicates the application of the fitted model to a new patient population that has not been used to fit the model.
The model was fitted by using a Bayesian framework with stochastic variational inference (SVI), maximizing the evidence lower bound (ELBO), with an Adam optimizer (learning rate = 0.03), using custom scripts in Python programming language (v3.9) and the PyTorch v1.12.1 (Paszke et al. 2019) and Pyro v1.8.2 (Bingham et al. 2019) packages. Model fit was assessed by comparing distribution of posterior predictive distribution against the data. Also, we report the mean and root-mean-square (rms) deviation between the model predicted mean and actual pain scores.
Incremental use case assessment
The clinical use of the model in assisting clinician, while remotely monitoring patients was evaluated in two ways. First, the number of datapoints required to obtain an accurate estimate of the parameter was evaluated. Therefore, the patient-specific offset was incrementally estimated for each of the study participants at the days where patients reported new pain scores. This was carried out using the same SVI fitting as described above. We ran this procedure for all study A and study B patients, and at each incremental step compared the estimated with the corresponding final value for a given patient (i.e., including all values reported by that patient). When the incrementally estimated value was within 1 point on the NRS from the final value, we considered the model as converged. This threshold was selected as it reflects the precision of the collected pain scores.
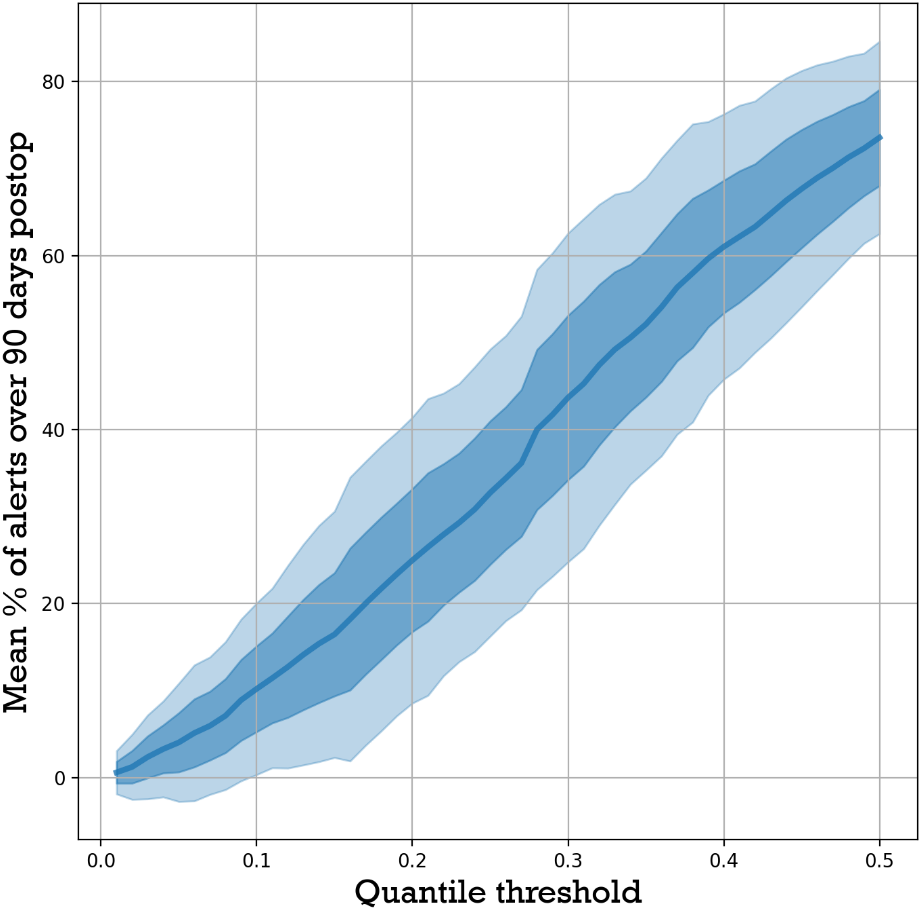
Second, to simulate the clinical use of the presented model in flagging pain scores at the extremes of the predicted expectation, we assessed the proportion of patient pain scores that would trigger an alert. This was done at each of the time steps that a new pain score was made available by the patients in the two studies by using the incremental estimation and a range of different quantile thresholds.

Results
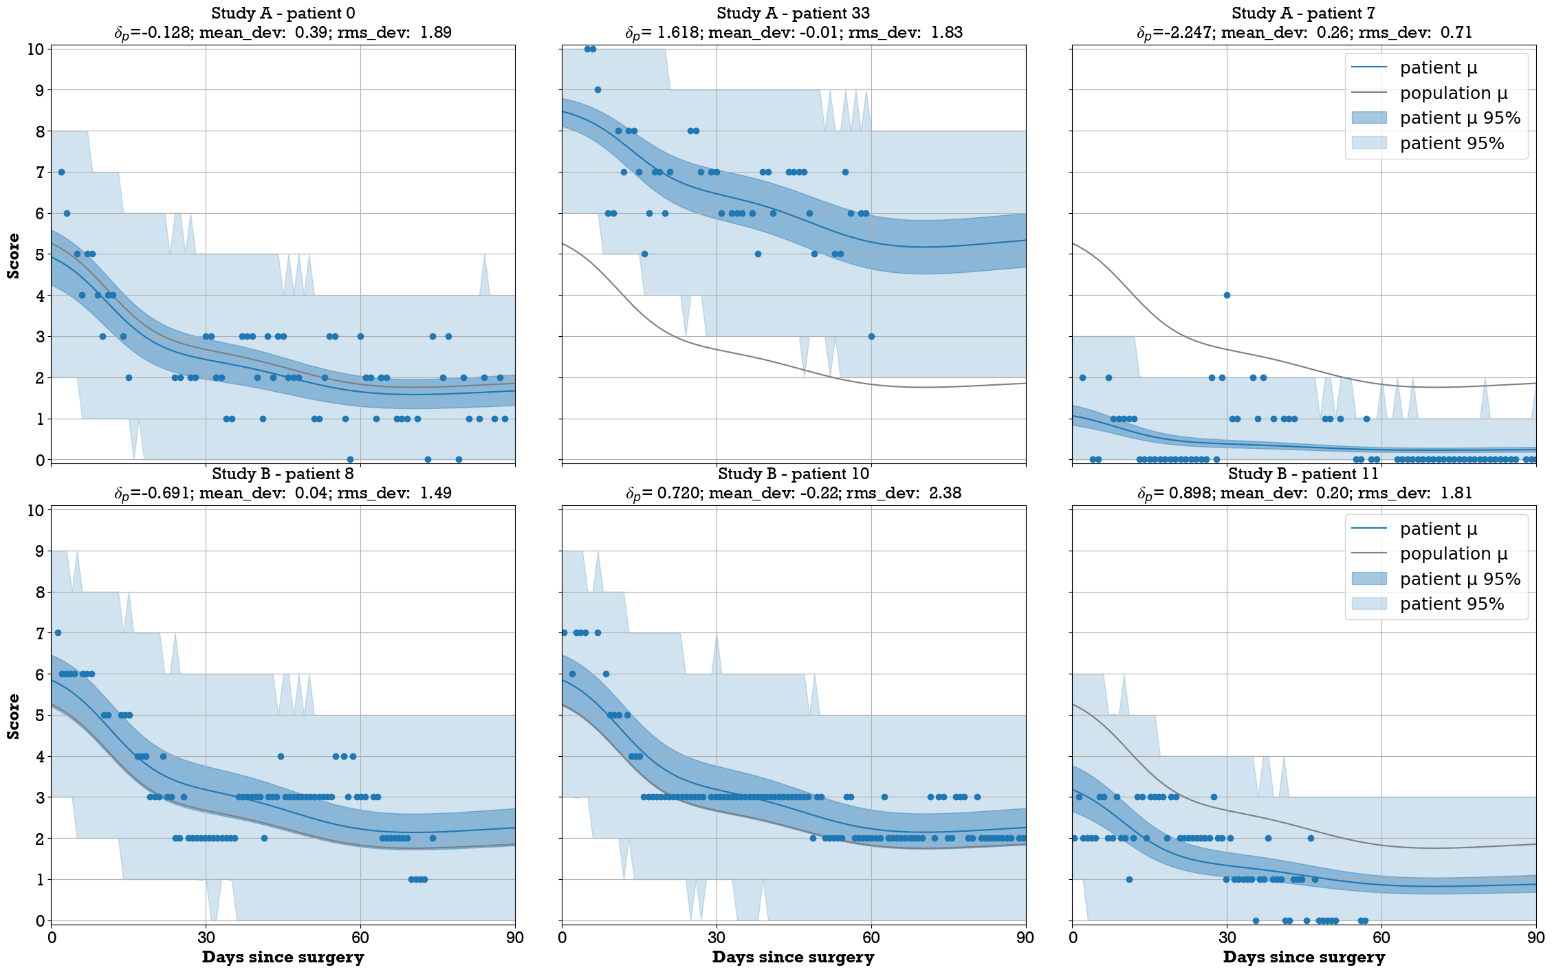
Applying the selection criteria resulted in a total of 3,649 pain scores from study A and 1,133 from study B. The mean (SD) number of scores reported by each patient within the 90-day period was 55.2 (24.4) for study A and 58.8 (30.0) for study B. Patient reported scores showed a wide dispersion of scores ranging throughout the 11-point scale during the first week postoperative, but gradually narrowing over time and becoming more concentrated on the lower half beyond 60 days after surgery (Figure 2). Individual patient trends varied widely, including cases where patients consistently reported low scores, others reporting consistently high scores (Figure 4).

Model fitting
The fitted mean population trend shows a steady decrease from a pain score of 5.2 on the first postoperative day to 1.8 on day 90. At a population level, the predicted range of pain scores shows a wide range (Figure 2). This is due to the large variation of estimated values for the patient-specific offset (Figure 3). By means of example, a few individual patients’ pain score progression following surgery is shown in Figure 4. The posterior mean (SD) for parameter σ was 0.81 (0.07). The average deviation from the patient scores and the predicted daily mean was smaller when including the patient effect for both studies (Table 1).


Incremental use case assessment
In general, the incremental fitting of pain scores showed a gradual convergence of the estimated parameter to the final value (i.e., using all available scores, e.g., Figure 5). The posterior uncertainty around this estimate also gradually decreased as more scores got added. The best estimate for the value of when none of the patients’ scores is available, is by the model definition equal to zero and therefore the mean of the expected distribution is the same as population mean. However, the uncertainty around this estimate is large (i.e., distribution in Figure 3 top panel). This uncertainty can only be reduced as we observe patient pain scores. The incremental estimation procedure corresponds to a Bayesian update of the value of parameter and its uncertainty with every new score. When the first score from a patient becomes available, the parameter is estimated using a normal distribution with σ variance as a prior, and in the subsequent steps the posterior from previous steps is used. The example in Figure 5 shows how patient reported scores that are further from the mean and on the tails of the expected distribution, correspond to more extreme quantile values. In this example, the value seven score under consideration (orange dot at post-operative day 78) has a corresponding low quantile value (i.e., the proportion of scores expected to be higher than seven given the predicted probability distribution).

To assess the number of patient-reported pain scores required to get a reliable estimate of the patient-specific offset we counted the number of scores required for the incremental patient-specific offset to be within one score value of the final mean (i.e., an assessment made on pain score scale). Looking at both studies, for 80% of patients this was attained with only the first five scores. It should be noted however that in one study A patient it took 21 scores and for one study B patient it took 41 scores to meet this criterion. These extreme cases corresponded to patients whose series of scores was very different from the modeled mean trend (no apparent trend) and therefore the estimation of a value that would best align was unstable.
Model triggered alerts
The alert simulation revealed that, as expected, the lower the threshold (i.e., high quantile) the higher number of triggered alerts targeting pain scores above the mean (Figure 6). The correlation between the quantile threshold and the mean number of alerts enables approximating the quantile threshold by targeting a percent number of alerts. This relationship was further validated by selecting quantile thresholds from study A data, for target 10, 20, 30, 40, and 50% alerts, and calculating the mean alert rates for study B, for those selected thresholds (Table 2). This assessment resulted on a rms accuracy of 3.9%.

Discussion
The remote monitoring of total knee patients during their recovery benefits from the ability to monitor their pain during the early post-operative period since it can be a precursor to various adverse events (e.g., infection). In order to give clinicians a reference framework facilitating the interpretation of patient-reported pain scores, while avoiding data overload for the monitoring clinicians, we proposed a model that predicts a daily probability distribution of remotely collected NRS pain scores for TKA patients along a 90-day recovery period. In a first step, we fitted the model to more than 3,500 remotely collected patient pain scores and subsequently validated the fitted trends with an additional study including more than 1,000 pain scores remotely collected from another cohort. This model is intended to assess the likelihood of incrementally available patient reported scores, giving clinicians the ability to raise flags for those patients reporting scores that fall beyond a preset likelihood threshold.
Population level normative curves are commonly used in clinical practice, with possible the most common example being child growth curves, and in the case of TKA patients the trend in range of motion with recovery (e.g., Kittelson et al. 2020). Due to the observed high variability and subjectivity in pain score trends, we found that population level trends are less clinically applicable given the large variability among patients. Instead, the presented model leverages population level trends while introducing a patient-specific offset to better approximate the individual patients’ pain score evolution.
The adjustment of the population level to a patient specific trend relied on estimation of the offset parameter for each patient. The incremental Bayesian update of this parameter as more patient scores become available proved useful. To confidently estimate this patient-specific offset parameter, five pain scores are to be reported by the patient during the post-operative phase. As such, it is recognized that the models’ ability to flag patients with abnormal pain scores is limited in the first week after surgery. Following this early post-operative period, the model provides the ability for a practice to flag a clinician-defined percentage of patients reporting pain scores at the extremes of the individual patients’ probability distribution. As such, the practice staff can focus on these patients with less likely pain scores and patients in the early post-operative window who are hypothesized to benefit most from adequate pain management. For those patients who are reporting pain scores in line with the expected distribution, limited focus of the clinical staff can be justified.
This study has some important limitations, however. First, it should be noted that we have not demonstrated that any of the triggered pain score alerts correspond to clinically relevant cases, such as the occurrence of complications (e.g., infection) during recovery. Therefore, the model allows clinicians to select a critical likelihood above which they wish to be alerted. Second, the patient-specific offset parameter, is estimated only from the history of patient pain scores, with the initial best guesses coming from the fitted marginal posterior distribution (i.e., Figure 3 top panel). Whereas an extensive series of close to 5,000 data points was used to train and evaluate the presented model, it should be recognized that the estimation of this parameter may benefit from additional data sources and including additional patients’ data. This would allow other covariates such as sex, age, and BMI to be included in the patients’ random effects. In this current model, these variables are however not explicitly included. Similarly, preoperative conditions and comorbidities have also been shown to determine the outcome after TKA (e.g., Lungu, Vendittoli, and Desmeules 2016; Jiang et al. 2017; Huber, Kurz, and Leidl 2019) and deserve consideration as a factor shaping the individual pain score trends. Within the current study, the patients’ pre-operatively reported pain score was not a good determinant for the post-operatively reported pain scores. Whereas this was surprising to the authors, it was also recognized that the patients’ (postoperative) analgesic regimen is of great importance for pain score modeling. However, this information was not available for the study patients, and therefore not included during the development of the model. Inclusion of any of these covariates in future models may not only further improve patient specific adjustments of but also potentially improve the shape of the recovery trend, as well as reduce prediction uncertainty in the early postoperative period that is currently only estimated from the patients’ history of post-operative pain scores and does not include any other covariates such as the patients’ age, BMI, sex or pre-operative pain level.

Conclusion
The use of sensor-based technology may aid in remotely monitoring patients. The ability to assess pain in postoperative TKA patients may provide clinicians with a way to detect postoperative problems and improve outcomes by identifying patients with an abnormal recovery pattern so appropriate interventions may be instituted in a timely manner. We proposed and demonstrated the use of a patient-specific pain score model that enables early automated detection of patients significantly deviate from the reference model and may require additional or more frequent engagement, effectively allowing to manage patients by exception rather than standard protocols.