

Introduction
In the quest to address the well documented dissatisfaction with the clinical outcomes of TKA first identified in the early 2000’s (Gunaratne et al. 2017), device manufacturers and surgeons have refined implant design and surgical techniques for TKA (Taunton 2019). Various options are now available with respect to femoral condylar and tibial articulation geometry such as constant vs. variable femoral radius designs and medial pivot vs. cruciate substituting models to name some options (Dall’Oca et al. 2017; Sabatini et al. 2018). Further, the use of computer guidance, robotics, personalized cutting guides, and navigation-based tools have been brought to bear to further minimize surgical variation from the intended outcome (Antonios et al. 2019; Chughtai et al. 2017; Franceschi and Sbihi 2014).
One area that has recently come under attention in the arthroplasty literature is the bony anatomy of the distal femur and its relationship to the rotational axis of the knee (Castelli et al. 2016; Nam et al. 2020). An understanding of this relationship is integral to efforts at restoring normal kinematics and proprioception following total knee arthroplasty (TKA) (Karuppal 2016). The primary rotational axis of the tibio-femoral articulation is the flexion-extension axis of the femur. This axis is dependent and defined by the surface anatomy of the distal medial and femoral condyles (Eckhoff et al. 2005). There is a generally held assumption that the lateral femoral condyle (LFC), particularly in “valgus” knees, is smaller (hypoplastic) than the medial femoral condyle (MFC) (Chhabra, Elliott, and Miller 2004). However, a paper by Howell et al. demonstrated that the radius of the lateral condyle was significantly 0.1mm larger than the medial condyle in 155 varus knees, and that the lateral condyle was 0.2mm larger than the medial condyle in 44 valgus knees (Howell, Howell, and Hull 2010). These studies, however, used small cohorts and manual measurements which may have limited their external validity. It is also unknown if the subchondral plate and by extension the radius of femoral condyles is impacted by arthritis, age, gender, or weight.
Underpinning many of these efforts is an everchanging understanding of the variation in human anatomy that continues to improve as more data becomes available from the digitization of clinical imaging and the availability of genomic and sensor generated data that was previously not accessible. Along with these new data sets, we are also seeing the increasing use of new tools with which to understand the vast quantities of data that are being generated (Beam and Kohane 2018; Pastorino et al. 2019). Artificial intelligence techniques implemented by data scientist and centered primarily around machine learning (ML) algorithms that identify associations rather than causation are becoming more common in the orthopaedic literature (Cabitza, Locoro, and Banfi 2018; Maffulli et al. 2020). Specifically, machine learning has been shown to be able to segment knee MRIs and differentiate between cartilage, bone, and meniscus with a high degree of accuracy using automated segmentation techniques (Norman, Pedoia, and Majumdar 2018; Morales Martinez et al. 2020). ML has therefore emerged as a useful tool that can help conduct highly accurate large scale anatomic studies without the manpower required to manually review each image and which addresses concerns with interobserver variability often associated with manual measurements (Shah et al. 2019).
The osteoarthritis initiative (OAI) is a database that provides a unique opportunity to apply ML techniques to study knee anatomy by making available high quality and consistently gathered digitized imaging data on a large population of patients (Eckstein et al. 2014). Patients included in the OAI have detailed demographic as well as high quality, research grade MRI images. The objective of this study was to leverage the OAI data base and ML techniques to measure and analyze femoral condylar radii on MRI images and determine conclusively if there is a difference in size between the medial and lateral femoral condyles of the human knee and if basic demographic factors or the stage and wear pattern of arthritis influence any measured asymmetry between the radii.

Methods
Study Sample
Patients in our analysis were selected from the Osteoarthritis Initiative (OAI) which contains demographic data, knee radiographs, and knee MRI studies on 4,796 patients (Eckstein et al. 2014). Each patient had imaging for either one or both of their knees. Information on patient age, gender, body mass index (BMI), and Kellgren Lawrence (KL) grade was collected. The Kellgren Lawrence (KL) grade in the OAI is determined by two expert readers with greater than 50 years of combined experience. They independently assess a weight bearing x-ray of each knee and are blinded to both each other’s reading and the subject’s clinical data. Only MRI series using DESS (double echo steady state) on a 3T MRI machine were included in our analysis.
Bone Segmentation
A validated machine learning segmentation model was used to identify which pixels of each MRI image represented which tissue type for each series of MRI images.
The model used in this study was a convolutional neural network (CNN) which converts the greyscale value of each pixel of an MRI image to one of several numbers representing several tissue types, including bone, cartilage, and meniscus.
The neural network model chosen for this problem is based on the U-Net architecture which has previously shown promising results in the task of segmentation particularly for medical images. The model was trained on 25 images which had been manually segmented by at our host institution. The resulting automatic segmentation model has previously been shown to accurately predict manual segmentation of a bone on a 60-image test dataset within 0.51mm and with an accuracy of 0.965 (Morales Martinez et al. 2020). This automatic segmentation was found to have comparable longitudinal precision to manual segmentation.
Data Collection
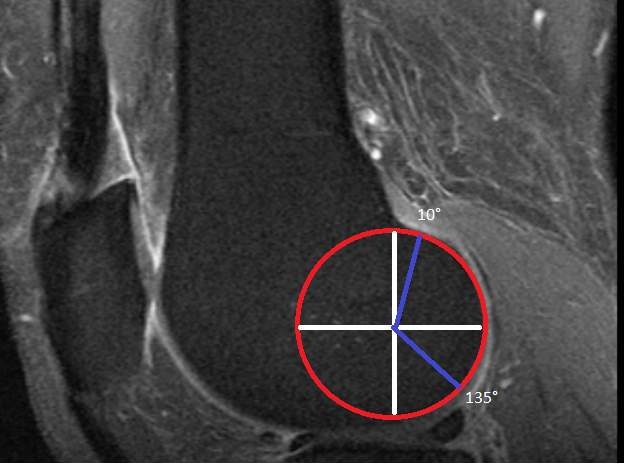
We calculated the radii of both the medial and lateral femoral condyle in each knee based on previously published methodology (Howell, Howell, and Hull 2010). It has been shown in several past papers that there is a bony arc from 10 to 160 degrees on both the medial and lateral posterior condyles that forms a perfect circle (Howell, Howell, and Hull 2010). Points along this arc have been used to define a circle and then calculate the area and radius of that circle. We set out to replicate and automate this methodology.
First, we aligned the MRIs so that the anatomic axis of the femoral shaft was parallel to the vertical axis of the image. The varus/valgus coronal axis was set by creating a line in between the distal femoral condyles and aligning that line to the horizontal axis of the image (Appendix I). The rotational axis was set by creating a line in between the posterior femoral condyles and aligning it to the vertical axis (Appendix II). This set the sagittal plane of the images that we would use to conduct our analyses. Next, for each femoral condyle, we selected 3 random points in the same sagittal plane along the subchondral bone of the femoral condyle to define circle subtended through a 10- to 135-degree arc. A visual depiction of this automated analysis is depicted in Figure I. A smaller arc was used when compared to previous papers (such as a 10-to-160-degree arc used by past papers [Howell, Howell, and Hull 2010; Matsuda et al. 2004].) to avoid the influence of posterior osteophytes which could have led to a miscalculation of the radius of the circle when using automated algorithms. Another circle was created from a second set of 3 points lying in the same plane and within the same arc as the prior circle which was compared to the original circle. If the radius between both circles had a difference larger than 1mm, the analysis was repeated with 2 new sets of 3 points along the arc. This creation of 2 circles was repeated until there was agreement within 1mm between the circles.

Data Analysis
For this analysis, we defined medial and lateral wear patterns by calculating the difference in the size of the articular gaps between the distal femur and proximal tibia in the medial and lateral compartments of each knee. Knees with medial wear patterns were defined as having a smaller medial than lateral compartment gap, while knees with lateral wear patterns were defined as having a smaller lateral than medial compartment gap. Knees with equal compartment gaps were considered to have a neutral wear pattern (defined as equal or bicompartmental wear).
We calculated the differences between the medial and lateral condylar radii for each MRI as well as the average and standard deviation for medial and lateral femoral condyle radius. These variations were sorted by KL score and compared with unpaired t-tests. We further investigated the variation of condylar radius in our sample by calculating the coefficient of variation based on increasing KL score. The coefficient of variation is a measure used to create a standardized measure of dispersion in a sample (Shechtman 2001).
Finally, we created a multivariable linear regression to investigate the risk-adjusted effect of each demographic variable (age, sex, and BMI), wear pattern (medial vs. lateral), and KL score on (1) the difference between the radii of the medial and lateral femoral condyle.
Results
6,829 knees were included in this study, of which 89% of the sample had a medial wear pattern and 85% of the patients were considered “non-arthritic” with a KL score of 0, 1, or 2 (Table 1). The average age of non-arthritic patients in the cohort was 60, while the average age of patients with osteoarthritis (KL score 3 or 4) was 64 years of age. The average BMI of non-arthritic patients in the cohort was 28, while the average BMI of patients with osteoarthritis was 30.
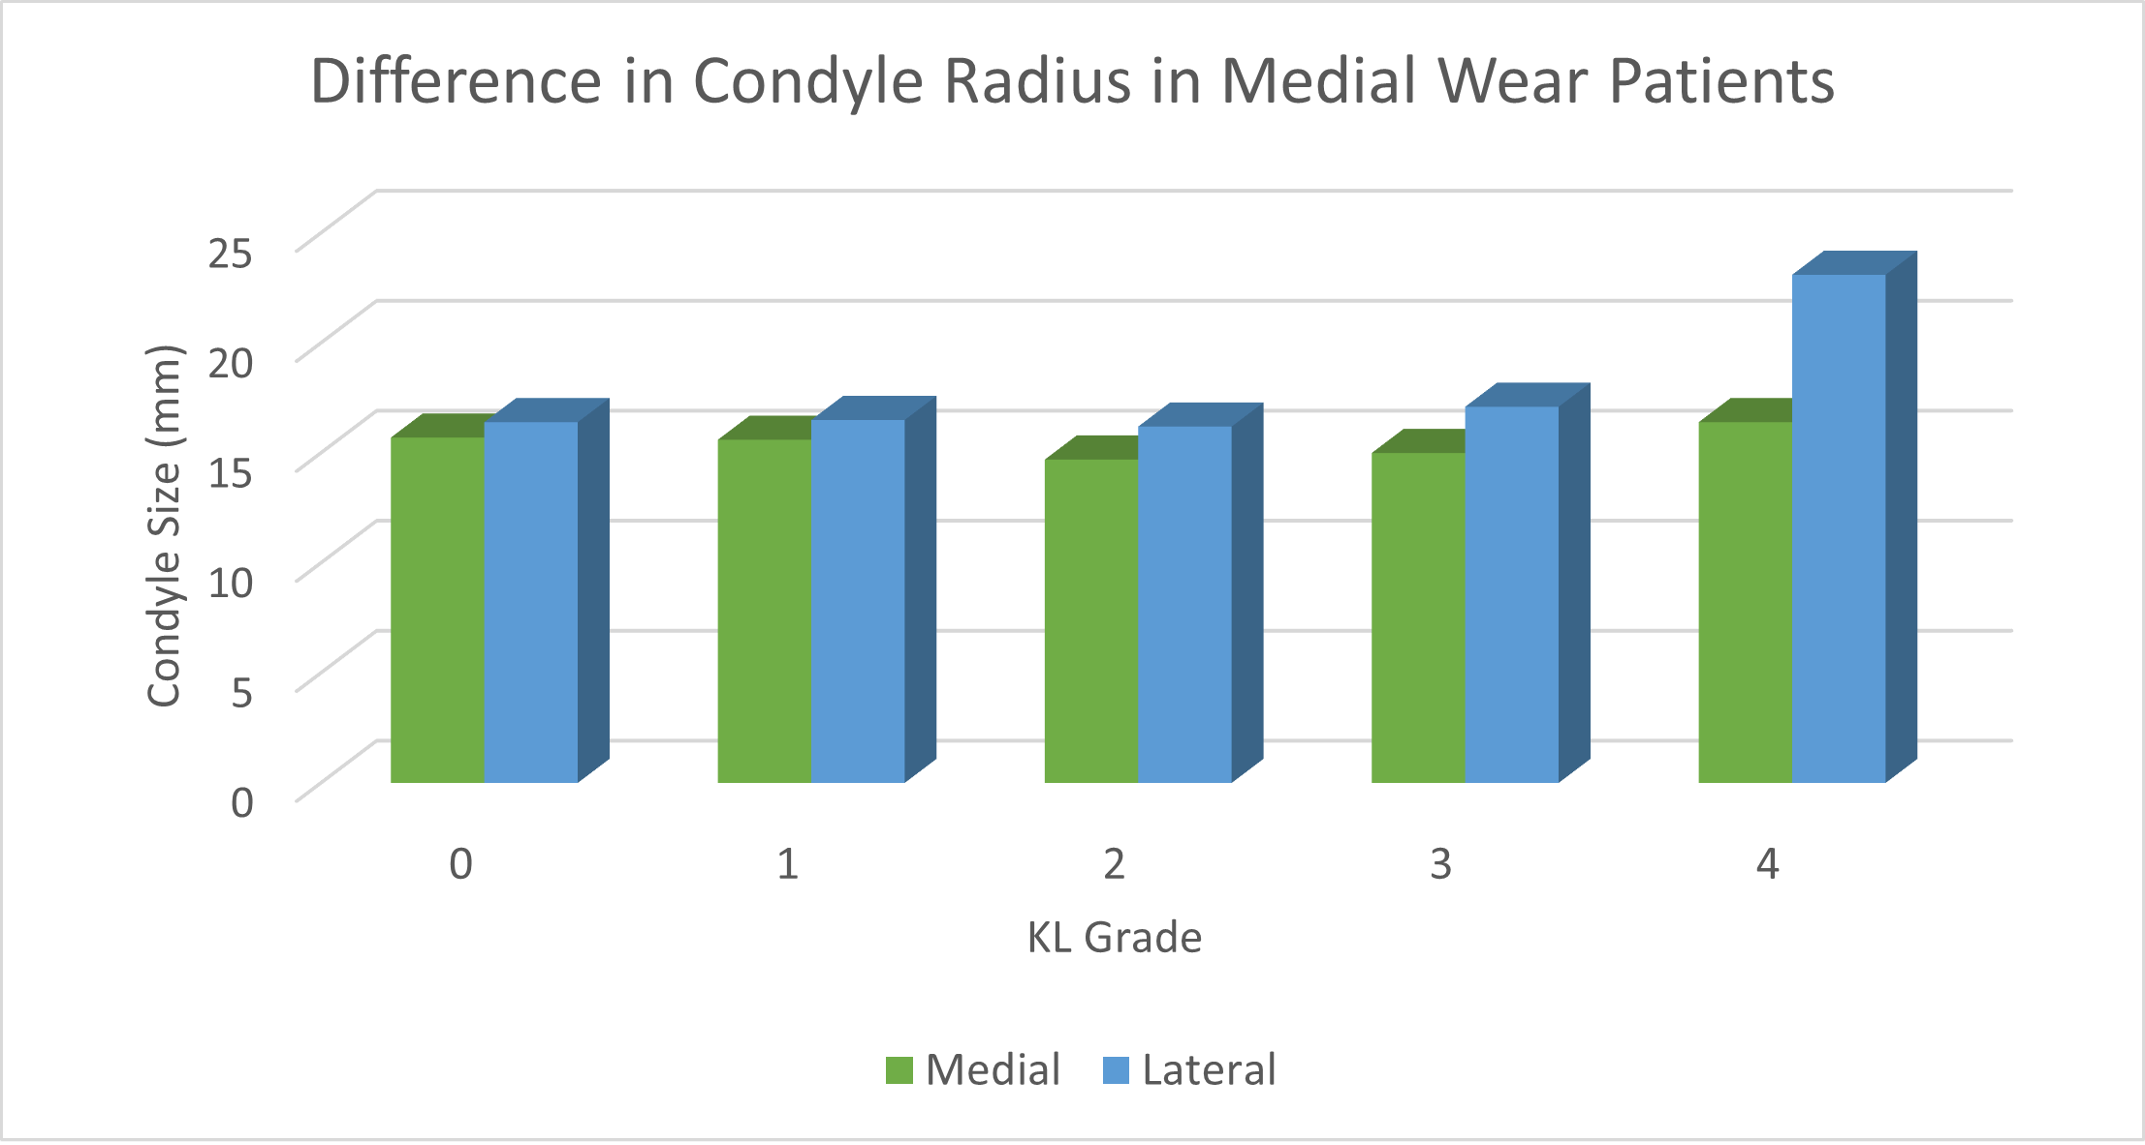
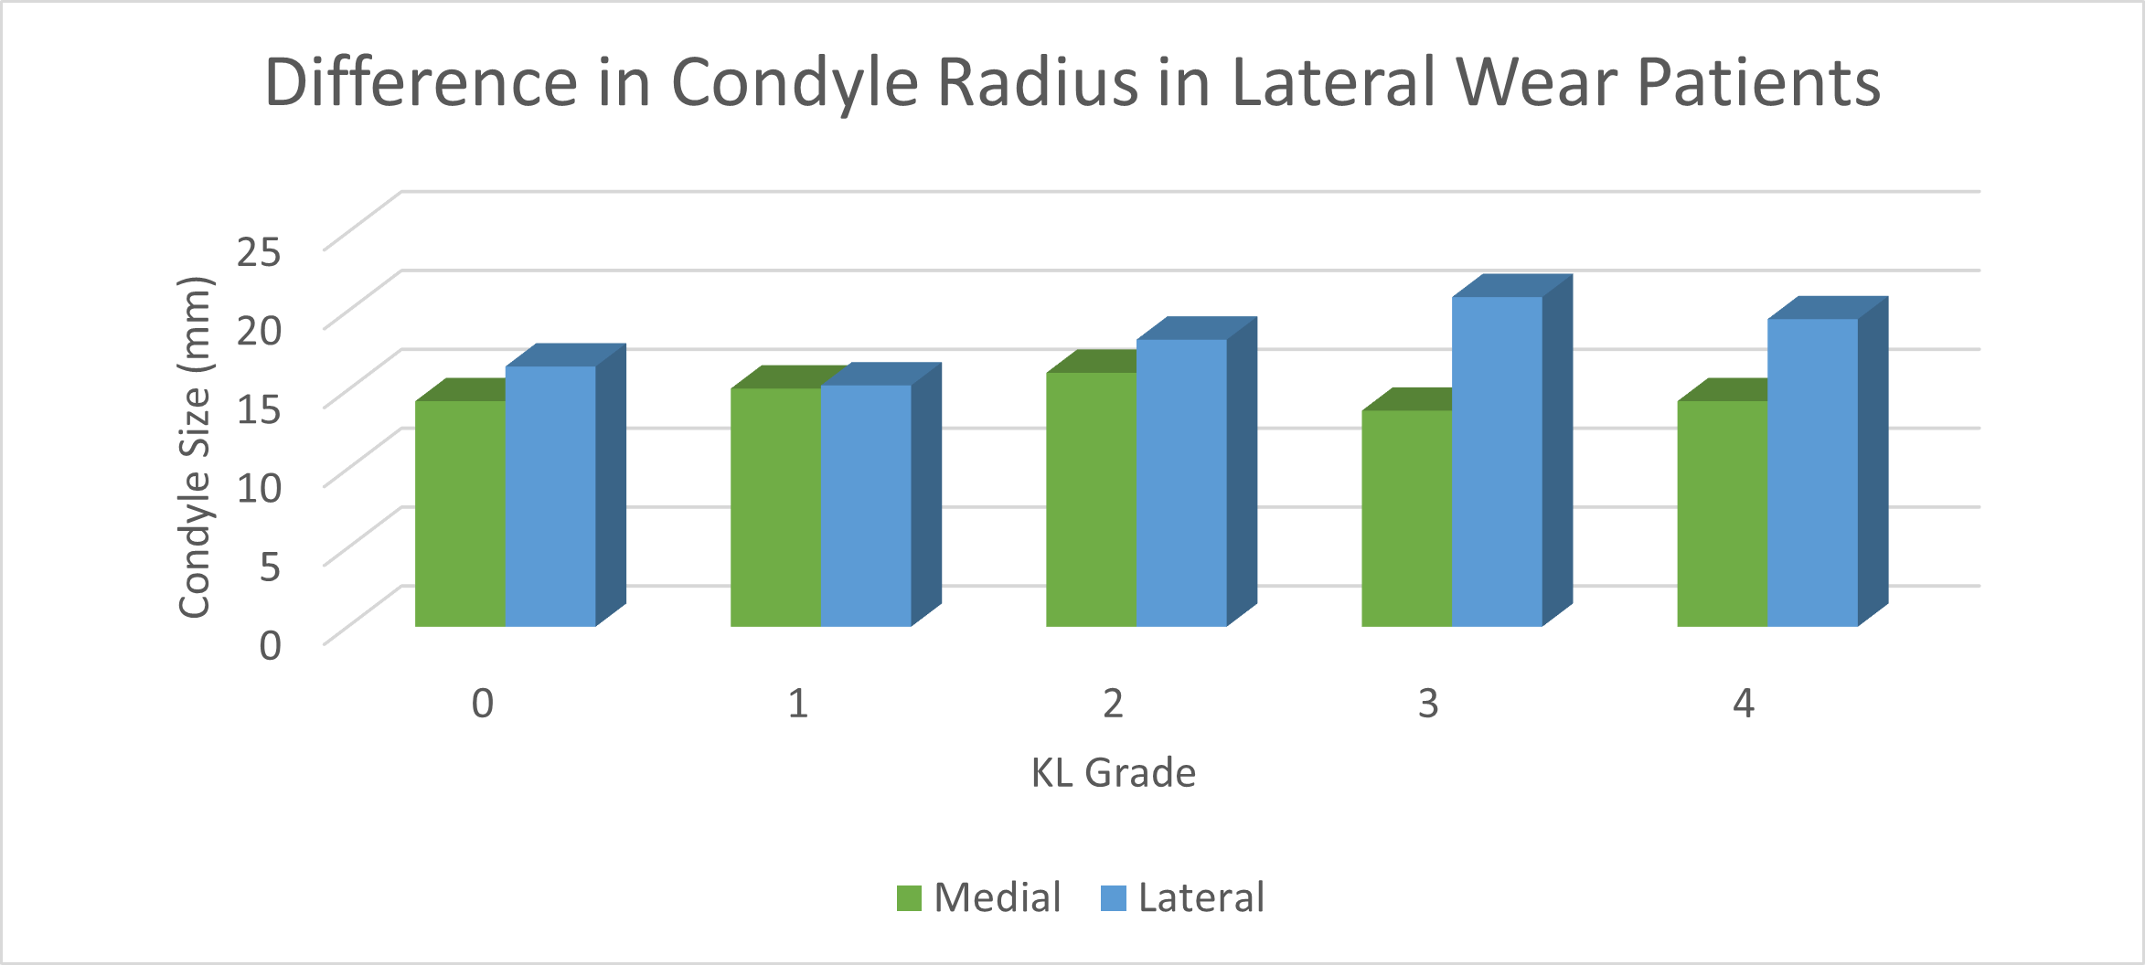
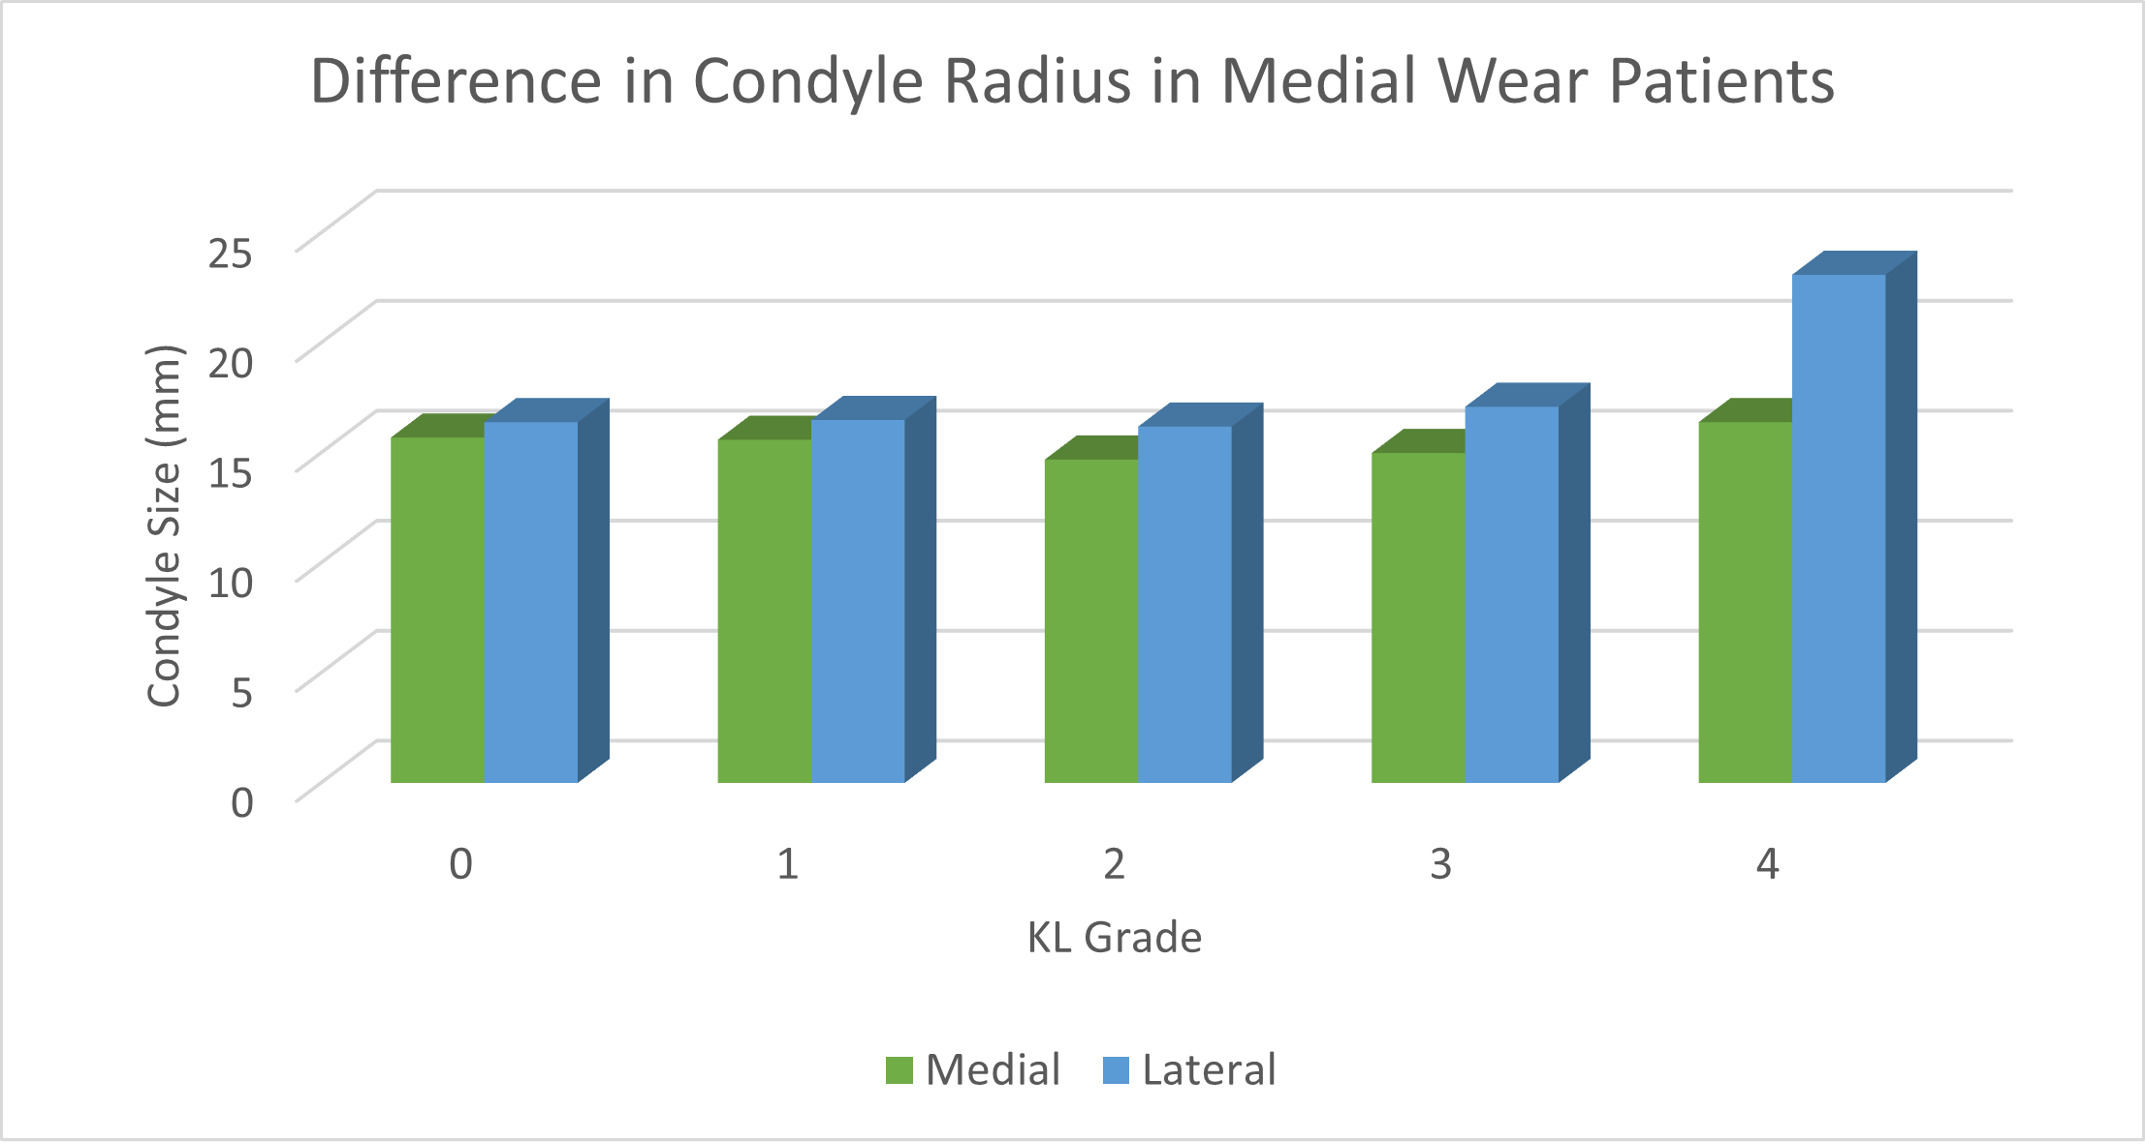
The average medial and lateral condyle size in all patients was 15.31mm and 16.75mm respectively (p<0.001). The difference in condylar radius between medial and lateral wear pattern patients sorted by KL score is depicted in Table 2. In patients with medial wear with KL 0, 1, 2, 3, and 4, the MFC was significantly smaller than the LFC (15.7mm vs. 16.4mm, 15.6mm vs. 16.5mm, 14.7 vs. 16.2mm, 15.0 vs. 17.1mm, 16.4 vs. 23.1mm, respectively; all p <0.01). The difference in condyle size in patients with medial and lateral wear patterns is depicted in Figure 2 and 3, respectively. As KL score increased, the average difference in radius between condyles also increased (Table 3). The coefficient of variation for KL 0 knees was 0.419 and for KL 4 knees it was 0.842.

After adjusting for age, BMI, and sex, patients with a lateral compartment wear pattern and patients with greater KL scores had a larger difference in radius between their lateral and medial condyle (p=0.003, p <0.001, respectively) (Table 4).

Discussion
This aim of this paper was to quantify whether there is a difference in the radius of the medial and lateral femoral condyles in the human distal femur. Contrary to the generally accepted belief that LFC is “hypoplastic” relative to the MFC, our study of over 6,800 patients demonstrates that the radius of curvature of the posterior condyles are roughly the same size and that where there is a difference, the LFC is the larger of the two condyles. We further identified an interesting association between advanced osteoarthritis and a greater mismatch in condylar radius. In fact, the lateral condylar radius is larger than the medial one in patients with more severe arthritis grades. The general misperception that the lateral femoral condyle is smaller than the medial is therefore not anatomically based but rather caused by the arbitrary realignment of the joint line into a fixed, non-anatomic position subjectively aligned to the patient’s mechanical axis that differs from their native alignment, regardless of the arthritic state of the knee. This could have implications in surgical technique and implant design for arthroplasty surgeons.
With respect to the absolute and relative radii of the femoral condyles, our study documented an average variance of 1.44mm between the medial and LFC that has been previously documented by smaller studies (Siebold et al. 2009; Papaioannou, Tashman, and Nelson, n.d.). Other authors have found no significant difference between the medial and lateral femoral condyle. A study by Matsuda et al. in 30 normal, 30 varus aligned osteoarthritic, and 30 valgus aligned osteoarthritis knees found no difference in medial and lateral femoral condyle size in any of the subgroups (Matsuda et al. 2004). A paper by Howell et al. studying 155 varus aligned knees found that the radius of the LFC was significantly larger than the medial condyle (Howell, Howell, and Hull 2010) by 0.1mm. Our study is the first to investigate this finding on a large scale in both healthy and osteoarthritic patients with different wear patterns and suggests that the lateral condyle is truly larger than the medial condyle in all knees when studied at a population level.
However, it is worth pointing out that the small average difference in the radii belies the occasionally large, statistically significant variance that we documented in several subsets of patients, particularly those with advanced osteoarthritis. This difference persists after adjusting for the variables available to us using a regression model. Coupled to our previously published data of differences as large as 3.46mm in the thickness of articular cartilage over the distal femoral condyles (0 to 3.46mm) in some patients (Shah et al. 2019), this information suggests that the anatomy of the distal femur is more complex and varied than has been previously considered and supports a personalized (rather than standardized) approach to the reconstruction of the knee joint if the goal is to restore normal physiology, kinetics and kinematics in the pursuit of the “forgotten knee”. Whether or not there is a causal relationship between a larger difference in side-to-side condylar radius and arthritis progression, the relationship is secondary (ie: osteoarthritis leads to the wear or remodeling of the condyles), or it is an unrelated finding cannot be stated from our data. A longitudinal data set would be required to identify a causal relationship.
Lastly, this is one of several recent papers using machine learning to understand variation in human anatomy using large datasets of digital images (Kijowski et al. 2020). The importance of so doing is to better quantify the breadth of variation in human anatomy which previously simply could not be done. In time, a clearer understanding of the variation of normal anatomy will help us move towards a more personalized approach to the reconstruction of joint replacements that considers such variation and, hopefully moves us closer to the holy grail of the “forgotten knee”. As this is bony anatomy, it is possible that further machine learning techniques will be able to make the same measurements on less invasive imaging modalities like X-Ray and CT scans which may make measurements like these much easier and cheaper to conduct.
The strengths of this study are numerous. First, the use of an automated, highly reproducible, and consistent verified algorithm-driven model for measurement of bony contours on MRI minimizes possible concerns related to interobserver variability introduced by the manual measurement of planar images. Second, the size of the cohort in question ensures that any patterns reported in the analysis are likely representative of variations that exist in the population under study. Third, our regression analysis considers several possible confounding factors that might otherwise influence the results reported. Fourth, the results confirm and are consistent with other smaller studies using both radiographs and computed tomography on this topic.
There are several limitations to this study. First, we were not able to account for race or height in the analysis as these data points were not available. However, it is unlikely that the ratios of the femoral condylar radii will vary even if the absolute radius of the condyles may vary in different populations. In addition, we used an automated method for calculating femoral condylar radius that matched previous methodology in terms of anatomic landmarks but acknowledge that the measurement method itself has not been validated and may not be as accurate as manual techniques. However, the methodology for the definition of the margins of the subchondral bone are accepted and validated, and the definition of a circle and its diameter based on two points on the circumference is based on a mathematical equation which is applied consistently across each image. Therefore, we believe that even if there were a minor difference in the absolute value of the radii if compared to a manual measurement, the reported ratio of the radii, which is the core goal of this paper, should not differ particularly as each measurement was repeated and validated using different points. Further, the magnitude of the radii we are reporting is comparable to those reported in past papers investigating femoral radius with manual techniques. Finally, it is possible that focal wear patterns of the posterior condyle may impact the calculation/identification of a perfect circle radius especially if there was a significant “flat spot” on a specific point of the condyle. However, we think that by calculating 2 circles on the same arc and comparing their sizes helped avoid this bias. Finally, only 11% of the knees were identified as lateral wear knees and this may not have been adequately powered to identify lateral condylar hypoplasia. However, there was still a large number of patients in this group given the large amount of patients in this study which makes it unlikely to have type II error.