Introduction
Diversity within the field of medicine has grown throughout the years; however, the gains have not been shared equally across all medical specialties (Emery and Carousel Presidents 2019). Identifying disparities in specialties such as orthopedic surgery is important because sex, race, and ethnicity reflect on patient care and leadership in medicine; increased diversity in these variables is correlated with improvements in doctor-patient communication and patient satisfaction and has contributed to more physicians working in underserved areas (“Diversity in Medicine: Facts and Figures 2019” 2019; Harrington et al. 2019; Reede 2003). Several studies have identified the underrepresentation of minorities and females in the field of orthopedic surgery (C. S. Day, Lage, and Ahn 2010; S. Poon et al. 2019; Grant, Banks, and Alleyne 1999; England and Pierce 1999; Sullivan and Mittman 2011; Templeton, Wood, and Haynes 2007).
The American Orthopaedic Association (AOA) and the American Academy of Orthopedic Surgeons (AAOS) recognized the deficits in the diversity of the field during the early 2000s. In 2002, the AAOS president Dr. Vernon T. Tolo explicitly stated, “It is important…to find the way… to insist that qualified women and minorities become an integral part of the Academy and orthopaedics” (“Board Approves Committee Appointments, EMTALA Compendium Development Protocol Forcooperative Ventures” 2002). Under the leadership of Dr. Tolo, the AAOS implemented the initiatives recommended by the AAOS Diversity Committee by partnering with programs that targeted minority groups and establishing an annual “AAOS Diversity Award” (American Academy of Orthopaedic Surgeons, n.d.). In the 2004 AOA presidential address, president-elect Dr. Edward Hanley highlighted the need to prioritize gender and racial diversification in the field (Jimenez 2007). In the years following the AOA address, symposiums were held to directly address racial/ethnic and gender diversity (The American Orthopaedic Association, n.d.). Recently, the AOA presidential address in 2017 by Dr. Regis J. O’Keefe outlined the continued lack of diversity among orthopedic surgeons (O’Keefe 2019).
Recognizing the topic of diversity, a comparative analysis was conducted utilizing 2007 data to explore diversity in the orthopedic surgery specialty across the academic spectrum (C. S. Day, Lage, and Ahn 2010). The study identified that orthopedic surgery falls behind other specialties in terms of minority and female representation (C. S. Day, Lage, and Ahn 2010). When compared to other specialties such as general surgery and non-surgical fields such as internal medicine, family medicine, and pediatrics, orthopedic surgery lagged behind (C. S. Day, Lage, and Ahn 2010). Recent studies with longitudinal snapshots identified that gender diversity among orthopedic residency programs gradually increased, while there has simultaneously been a downward trend in the number of underrepresented minorities (URMs) in these programs (S. Poon et al. 2019; Adelani, Harrington, and Montgomery 2019; Cannada 2016). Additionally, orthopedic surgery continues to be identified as the specialty with the lowest representation of women (S. Poon et al. 2019). However, these studies excluded populations such as Asian-Americans in their analyses due to the limited inclusion criteria of URMs and did not explicitly make comparisons between orthopedic applicants and resident populations.
The primary objective of our study is to determine how diversity in orthopedic applicant and resident populations has changed from 2007 to 2019. The secondary objective is to compare current diversity demographics of orthopedic applicants and residents to each other, as well as to other surgical and non-surgical fields. Our study hypothesizes that there has been an increase in gender and racial diversity in orthopedic surgery applicants and residents between 2007 and 2019; however, we also hypothesize that orthopedic surgery continues to lag behind other specialties when comparing diversity metrics.
Materials and Methods
Demographic data was collected from the publicly available sources, including the Accreditation Council for Graduate Medical Education (ACGME) Data Resource Book for 2006-2007 and 2018-2019 (Accreditation Council for Graduate Medical Education, n.d.), the Association of American Medical Colleges Electronic Residency Application Service (AAMC) (ERAS)(“FACTS: Electronic Residency Application Service (ERAS) Data” 2019), the AAMC FACTS Database (“FACTS Database and Glossary,” n.d.), and the Journal of American Medical Association (JAMA) publications titled “Graduate Medical Education, 2006-2007” (Brotherton and Etzel 2007) and “Graduate Medical Education, 2018-2019” (Brotherton and Etzel 2019). Due to availability of data at the time of analysis, we used snapshot data from JAMA collected on December 2, 2018, to approximate demographics of resident and applicant racial/ethnic data for 2019 (Brotherton and Etzel 2019). Several of these sources utilize the Graduate Medical Education (GME) Track database, which collects data from ACGME-accredited residency programs that participate in the GME Track Resident Survey. The response rate for this survey typically varies from year to year, which was 89.6% in 2007 and 95.7% in 2019 (Brotherton and Etzel 2007, 2019). The data archives were utilized to determine the racial and gender composition of medical school graduates, residency program applicants, and residents.
The main variables used to measure diversity are race, ethnicity, and gender. Race was defined as identifying as White, Black or African American, Asian, and Other (“FACTS Database and Glossary,” n.d.). Ethnic groups were divided into Hispanic/Latino and non-Hispanic/Latino, as is the classification used by the U.S. Census Bureau (“Hispanic or Latino Origin,” n.d.; “Race,” n.d.). For a race or ethnicity to be listed individually, the inclusion criteria were set to include only racial or ethnic groups that reached above a 5% representation threshold in the general U.S. population, according to the U.S. Census Bureau (“Hispanic or Latino Origin,” n.d.; “Race,” n.d.). Racial/ethnic groups below the 5% threshold were combined into an aggregate category called “Other,” which included those identifying as American Indian/Alaskan Native, Native Hawaiian/Pacific Islander, multiracial, unknown, and other (“FACTS Database and Glossary,” n.d.). Furthermore, an aggregate “Minority” category, defined by the Population Reference Bureau as anyone who identifies with a racial or ethnic group other than non-Hispanic White, was utilized throughout data analysis as a generalized indicator of racial/ethnic diversity (“Population Reference Bureau,” n.d.). As for gender, subjects were divided into men and women (“FACTS Database and Glossary,” n.d.).
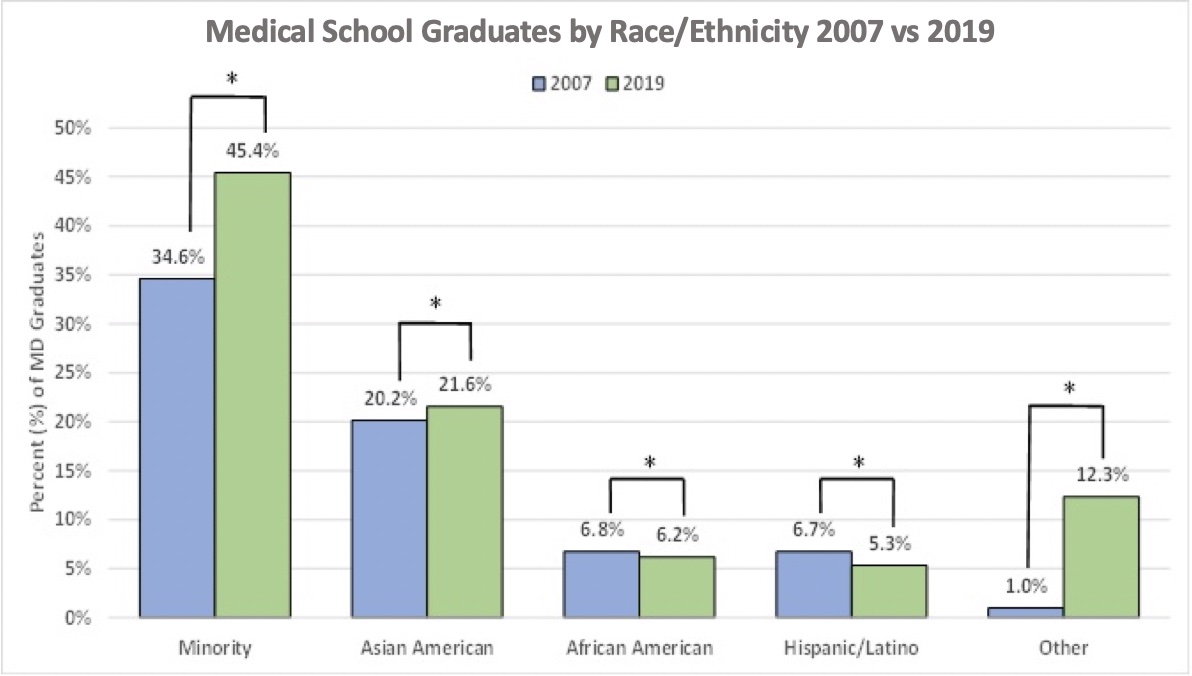
In order to establish a baseline population from which applicants and residents are derived, comparisons were made between the demographic compositions of the 2007 and 2019 U.S. medical school graduating classes (Figure 1). For both orthopedic surgery and general surgery, the racial and gender compositions of applicant pools were then compared between 2007 and 2019 (Figures 2A-B, Figure 3), and comparisons between the two specialties were also conducted to address the variables that impact medical specialty choices such as the nature of the “work, salary, training, competitiveness, and workforce” (“Careers in Medicine,” n.d.). In regard to our analyses on residents, the demographics of 2007 and 2019 orthopedic surgery residents were compared to the resident populations of selected surgical and non-surgical fields regarding race, ethnicity, and sex (Figure 4, Figures 5A-B, Figure 6, Figure 7). The selected surgical and non-surgical fields include neurological surgery, otolaryngology, general surgery, internal medicine, family medicine, pediatrics, and obstetrics/gynecology (OB/GYN). Additionally, comparisons were made between all identified specialties to analyze their current diversity demographics in 2019.


All analyses were done using chi-square or Fischer’s exact tests for categorical variables. Fischer’s exact test was chosen when 25% or more of cell counts were below 5. A Benjamini-Hochberg adjustment was applied to relevant p-values to control the type I error rate, decreasing the probability of a false significant difference finding. Adjusted p-values are noted with an asterisk (*). Statistical significance was set at a p-value of less than 0.05. All analyses were performed using SAS 9.4 (SAS Institute Inc, Cary, NC, USA).
Results
Diversity in Orthopedic Surgery Applicants and Residents from 2007 to 2019
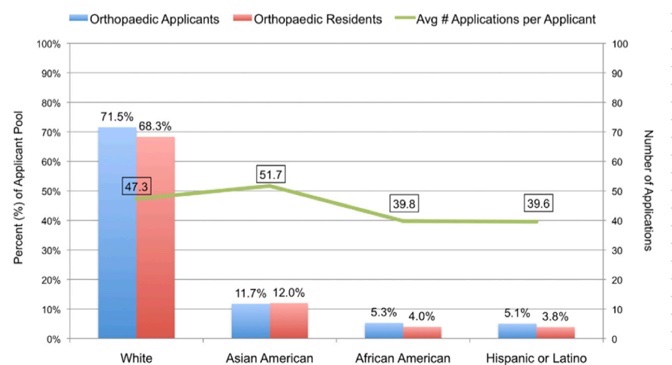
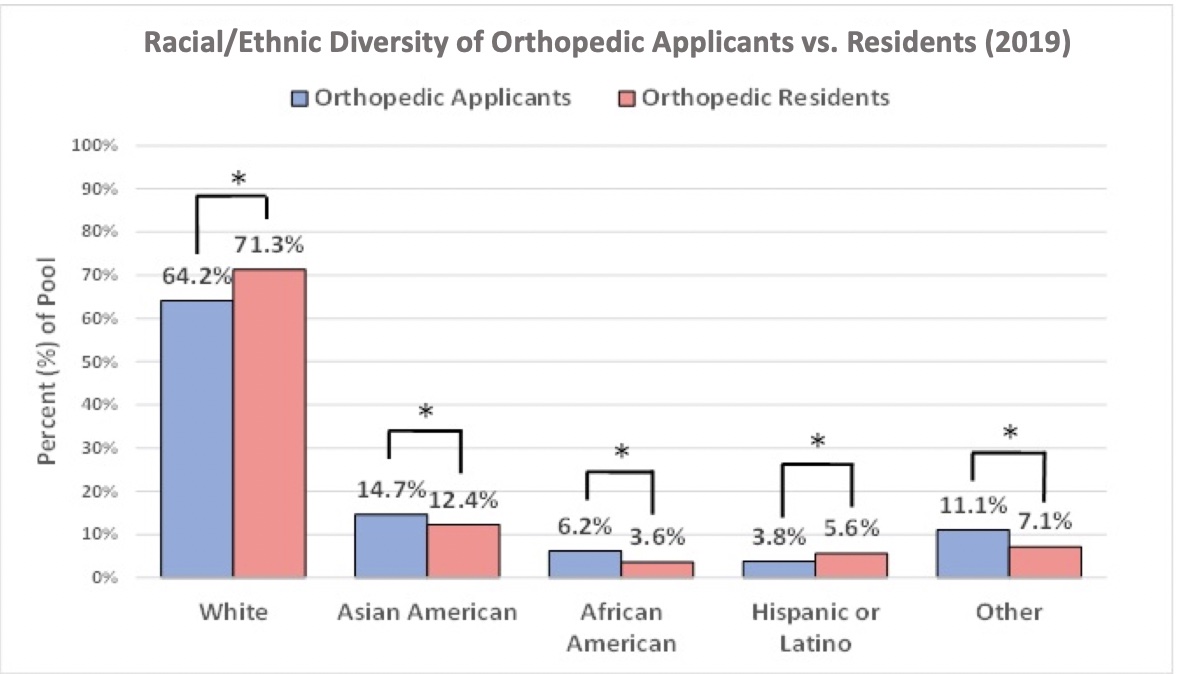
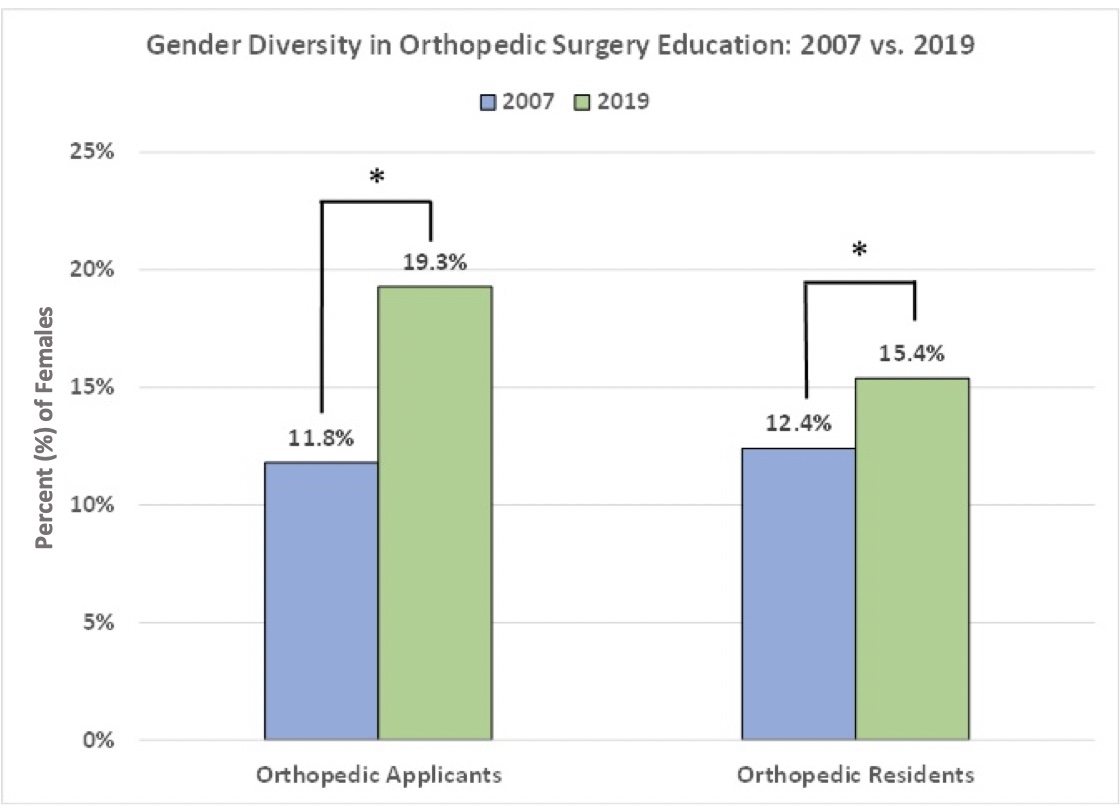
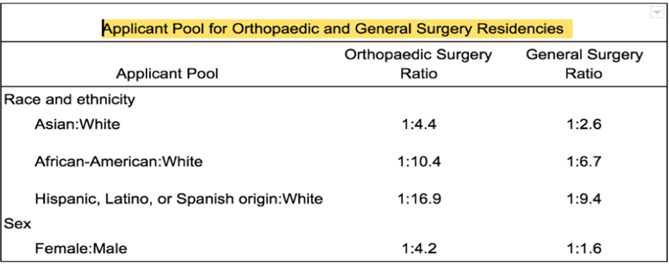
In a comparative analysis of orthopedic surgery applicants from 2007 to 2019, the proportion of minority applicants experienced a 26% increase from 28.5% to 35.8% (p < 0.001) (Figures 2A-B. When analyzing each race and ethnicity individually, Asian-American applicants experienced a 26% increase from 11.7% to 14.7% (p = 0.038). In contrast, African American and Latino/Hispanic applicants experienced no significant changes from 2007 to 2019 (17% increase from 5.3% to 6.2% (p = 0.591) and 26% decrease from 5.1% to 3.8% (p = 0.375), respectively). Furthermore, the collective proportion of races and ethnicities within the “Other” category experienced a 73% increase from 6.4% to 11.1% (p < 0.001*). Regarding gender, the proportion of female orthopedic surgery applicants experienced a 63% increase from 11.8% to 19.3% (p < 0.001*) during this time period (Figure 3). As a result, the 2019 female-to-male ratio of orthopedic surgery applicants was approximately 1:4 (Table 1).

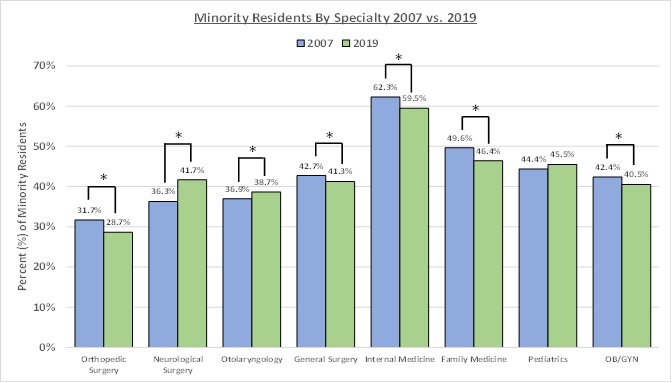
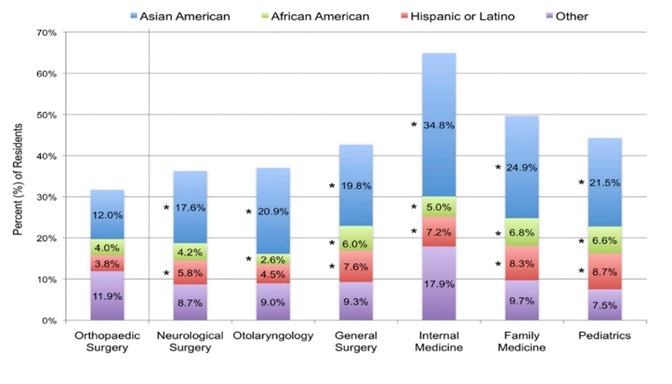
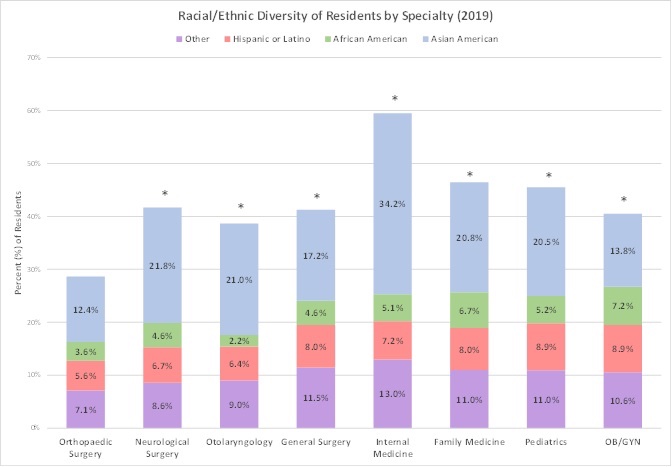
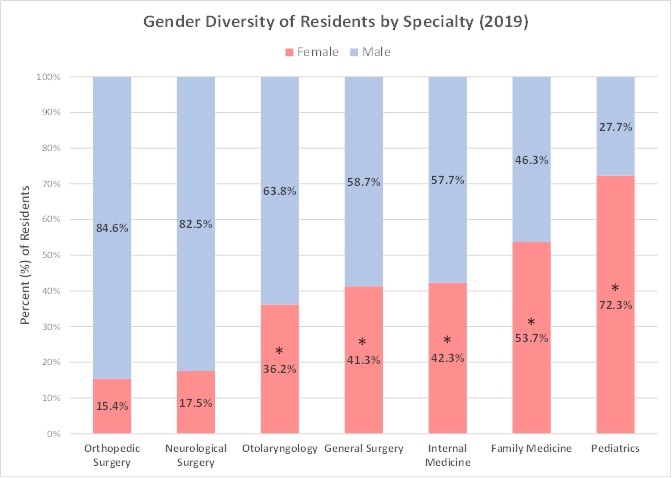
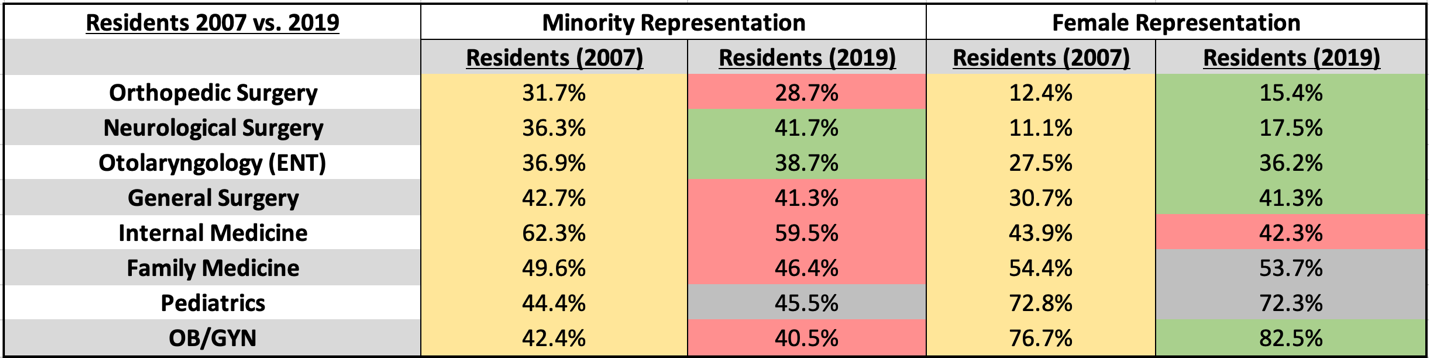
When comparatively analyzing diversity among residents between 2007 and 2019, the proportion of minority orthopedic surgery residents showed a 10% decrease from 31.7% to 28.7% (p = 0.004) (Figure 4). When analyzing each race and ethnicity individually, orthopedic surgery residents experienced no statistically significant changes in Asian-American or African American representation between the two years (3% increase (p = 0.591) and 10% decrease (p = 0.375), respectively) (Figures 2A-B, Figures 5A-B). Meanwhile, there was a 46% increase in Hispanic/Latino residents (p < 0.001) and a 40% decrease in “Other” residents (p < 0.001). During the same time period, general surgery, internal medicine, family medicine, and OB/GYN all similarly experienced significant decreases in their minority representation (p < 0.05) (Figures 5A-B, Figure 7). Regarding gender, the proportion of female orthopedic surgery residents experienced a 24% increase from 12.4% in 2007 to 15.4% in 2019 (p < 0.001) (Figure 3). During the same time period, neurological surgery, otolaryngology, general surgery, and OB/GYN similarly experienced significant increases in female representation (p < 0.05) (Figure 7).
Comparative Diversity in Orthopedic Applicants and Residents with Other Specialties
When comparing diversity in orthopedic applicants and residents in 2019, there was a significant gap between the proportion of minority applicants at 35.8% and residents at 28.7% (p < 0.001). Furthermore, the comparative analysis revealed a significant gap between the proportion of female applicants at 19.3% and residents at 15.4% in 2019 (p < 0.001). In comparison, general surgery had the opposite difference between its proportion of female applicants and residents at 39.0% and 41.3%, respectively (p = 0.006). When comparing the diversity of all included specialties in 2019, orthopedic surgery exhibited the lowest percentage of minority residents at 28.7% (p < 0.001*) (Figure 4). With the exception of female representation in neurological surgery at 17.5% (p = 0.055*), orthopedic surgery also exhibited the lowest proportion of female residents at 15.4% (p < 0.001) (Figure 6).
Discussion
As the need for diversity continues to permeate throughout the medical profession, it is increasingly important for us to monitor the progress of diversity in orthopedic surgery and identify areas of improvement. Despite increases in gender diversity of orthopedic applicants and residents from 2007 to 2019, minority applicants increased by 26% while minority residents decreased by 10% during the same time period. The significant difference between minority applicants at 35.8% and minority residents at 28.7% suggests the possible existence of barriers to minority acceptance in the orthopedic residency selection process. In 2020, a study carried out at Northwell Health, the Donald and Barbara Zucker School of Medicine at Hofstra/Northwell, Columbia University, and Shriners for Children Medical Center investigated this issue by examining 8,966 orthopedic applicants from 2005 to 2014 to determine whether race and gender were independently associated with successful admission (S. C. Poon et al. 2020). When controlling for academic metrics such as USMLE Step 1 scores, publications, and volunteer experience, they determined that minority applicants, but not women applicants, had lower odds of being accepted into orthopedic surgery residency programs than their white counterparts, revealing potential inequalities in admission practices (S. C. Poon et al. 2020). Although the subsequent effects of this implicated bias were not specifically examined in their study, our results substantiate their findings by revealing an increase in minority applicants alongside a decrease in minority residents, thus demonstrating a lower acceptance rate for minority applicants from 2007 to 2019. Based on the collective results from both these papers, orthopedic residency programs can potentially guard against this inherent bias towards minority applicants via: (1) a blinded review process for orthopedic applicants in regards to demographic information, (2) ensurance that an interviewer of minority/female representation is part of every applicants’ interview process, (3) when creating the final ranking list of applicants, the interview impression is only a portion of the applicants’ consideration. In addition to these recommendations for the orthopedic residency selection process, we further encourage systematic mentorship by senior orthopedic faculty for females, African Americans, Hispanics, and other underrepresented medical students to improve their acceptance rate into orthopedic residency programs (K. M. Day et al. 2016).
When comparing diversity of orthopedic surgery applicants and residents to other surgical and non-surgical specialties, our analysis demonstrated several key findings. For 2019, orthopedic surgery was revealed to have the lowest proportion of minority residents at 28.7% compared to the other 7 specialties. These findings were consistent with another study out of Harvard Medical School that found orthopedic surgery to have the lowest percentage of Hispanic/Latino and Asian-Americans residents when compared to sixteen other fields of medicine from 2001 to 2008 (Okike, Utuk, and White 2011). While their study found that Asian-American residents in 198 orthopedic residencies increased the most among all racial/ethnic groups from 1995 to 2008 (Okike, Utuk, and White 2011), our study demonstrated Hispanic/Latino residents to have the greatest increase in representation from 2007 to 2019. Considering orthopedic surgery’s overall 10% decrease in minority residents, however, significant increases in Hispanic/Latino residents were likely offset by the significant decrease in residents represented within the “Other” category. However, we also note that general surgery, internal medicine, family medicine, and OB/GYN also experienced decreases in their minority resident representation, which could potentially indicate that these decreases in racial and ethnic diversity may be attributed to factors not unique to orthopedic surgery.
Despite increases in gender diversity for both orthopedic applicants and residents since 2007, orthopedic surgery continues to hold the lowest proportion of female residents in 2019 when compared to the other surgical and non-surgical specialties (excluding neurological surgery). In recent years, another study out of Columbia University similarly demonstrated growths in gender diversity for orthopedic applicants and residents from 2006 to 2015 (S. Poon et al. 2019). However, our results also demonstrated significant increases in female residents for neurological surgery, ENT, and general surgery, and as a result, this could suggest an overall elevated interest in surgical fields for women rather than distinct diversity improvements for orthopedic surgery. Nonetheless, a 2013 study out of Harvard Medical School found that from 1970 to 2010, female representation in general surgery residency was growing at a faster rate than orthopedic surgery residency (Hill et al. 2013).
This study has several limitations. Many of the database sources, including the AAMC and JAMA, rely on individuals’ self-reporting of race and ethnicity. This method of data retrieval is limited in that it does not include the people who did not self-report their race or gender. For comparative analysis, it is implied that reasons for not self-reporting demographics would be similar across all the fields analyzed. Second, respondents are able to select multiple races or ethnicities from which they identify. With this in mind, we utilized the sum of responses for each distinguished race or ethnicity selection as the total sample size for each group, rather than the AAMC reported totals, for data aggregation and analysis. Third, different sources were required due to the limited collection of data and the need for specific population analyses. Such sources may have utilized varying data collection methodologies. Despite the differences in sources, consistency was kept within data sets utilized for comparisons. Fourth, making comparisons between the years 2007 and 2019 could have presented anomalies for orthopedic surgery. However, statistical analysis demonstrates that orthopedic surgery program applicant’s distribution between 2018 and 2019 are similar except for the representation of Hispanic/Latino groups (50% decrease, p < 0.001) and growth of female applicants by 18% (p < 0.034).
Conclusion
Since 2007, orthopedic surgery has experienced some improvements to diversity due to an increase in female and minority representation among orthopedic applicants. Despite an increase in female residents for orthopedic surgery, this growth in diversity of applicants did not fully translate to growth in diversity of residents, since orthopedic surgery experienced a decrease in minority residents. With few exceptions, orthopedic surgery continues to present the lowest proportions of female and minority residents when compared to other specialties. To increase diversity within the field, more efforts are needed to ensure that diverse applicants are selected into orthopedic surgery residency programs. Two potential ways of accomplishing this are: (1) intentional efforts to reduce bias in the orthopedic residency selection process, including blinding of applicant reviews, diverse interviewers, and increased final ranking of minority and women applicants of equal qualification, along with (2) systematic mentorship by senior orthopedic faculty for female and minority medical students who are interested in orthopedic surgery (Templeton, Wood, and Haynes 2007). In 2020, a study out of the University of Mississippi Medical Center also highlighted the idea that increasing minority representation in faculty leadership may draw minority applicants to orthopedic surgery.32 Their investigation determined that orthopedic residency programs with greater numbers of URM faculty had higher percentages of URM residents (McDonald et al. 2020). By implementing new efforts to increase diversity within the specialty, orthopedic surgery can move closer to accessing the many benefits of a diverse physician workforce in order to further enhance patient care within the field.
Acknowledgements
The authors would like to thank the American Association for Medical Colleges (AAMC), the Accreditation Council for Graduate Medical Education, and the Journal of the American Medical Association (JAMA) for their contributions towards providing publicly available data for academic and scholarly research.