Introduction
Total hip arthroplasty (THA) is one of the most frequently performed orthopaedic surgeries with millions of procedures performed annually worldwide (Pivec et al. 2012). THA procedures have outstanding short- and long-term outcomes (Pivec et al. 2012). However, a subset of patients do not achieve satisfactory outcomes and experience reduced quality-of-life due to persistent pain and functional limitations following THA. A recent national study suggested nearly one-third of THA patients reported hip pain 12 to 18 months after surgery and 12% of those patients experienced limitations in daily activities due to pain (Nikolajsen et al. 2006). For these reasons, patients and surgeons require pre-operative assessment tools to aid in shared surgical decision-making and to guide prognostic discussions for a patient’s potential post-operative course (Berliner et al. 2016). Patient-reported outcome measures (PROMs) are one tool that have been shown to be helpful as a preoperative assessment tool for shared decision-making (Berliner et al. 2016; Makhni et al. 2019).
PROMs are assessment instruments completed by patients that measure outcomes pertaining to health status, physical function, and quality of life. PROMs have become the gold standard for outcome measurement in research and clinical practice (Jackowski and Guyatt 2003; MOTION Group 2018; Swiontkowski et al. 1999; Poolman et al. 2009). By quantifying a patient’s pre- and post-operative perception of health and functional status, PROMs can guide collaborative surgical decision-making for the patient and the surgeon. The Hip Osteoarthritis Outcome Score Joint Replacement (HOOS JR) is a PROM that is commonly used for patients undergoing THA. The HOOS JR is a valid and reliable psychometric test and provides domain-specific measures of pain, symptoms, physical function, and quality of life (Jacobs et al. 2018; Lyman et al. 2016). However, the question of what constitutes a meaningful clinical change in the HOOS JR following THA has not been well described in the literature. Statistical significance has historically been used to identify the effectiveness of an intervention. However, statistical significance has well known limitations including spurious clinical differences being found as a result of increasingly larger sample sizes (Leopold 2013; Sterne and Davey Smith 2001). The Minimum Clinically Important Difference (MCID) seeks to address this problem, and it may be a better method to evaluate the effectiveness of a clinical intervention (Jaeschke, Singer, and Guyatt 1989).
The MCID is the smallest change in an outcome score of interest that is clinically meaningful to a patient’s functional status or health outcome (Jaeschke, Singer, and Guyatt 1989; Kim and Park 2013; Copay et al. 2007). Multiple methods are described for calculating MCID (Wright et al. 2012), but there is currently a lack of consensus as to which method is superior (Wyrwich et al. 2005; Revicki et al. 2008). MCID is most commonly derived from anchor-based or distribution-based methods. In the anchor-based approach, PROM scores are paired with another subjective PROM such as a global rating scale. Changes in the PROM being evaluated are compared with changes in the paired subjective PROM to determine MCID. In the distribution-based methods, it is assumed that there is some measure of PROM variability, such as standard deviation, that represents MCID and therefore compares changes in PROM scores to an objective measure of variability such as the standard deviation or effect size (Berliner et al. 2016; Copay et al. 2007; Wyrwich et al. 2005; Chesworth et al. 2008; Norman, Sloan, and Wyrwich 2003; Quintana et al. 2005; Copay, Chung, et al. 2018, 2018; Copay, Eyberg, et al. 2018).
As PROMs expand to inform clinical decision-making, it is important to determine the MCID for each of the various PRO instruments. However, there has been minimal research with variable outcomes regarding the HOOS JR MCID (Berliner et al. 2016; Lyman et al. 2018). The primary aim of this study is to determine the HOOS JR MCID at two time intervals and to evaluate different methods for calculating the HOOS JR MCID for patients undergoing THA.
Methods
Data was prospectively collected from a patient-reported outcome database at a single outpatient ambulatory surgery center in a major metropolitan area for patients treated operatively with THA between 2017 and 2018. Inclusion criteria included patients who 1) completed post-operative clinic follow-ups at 3-months and 1-year and 2) patients who completed both a general Patient-Reported Outcomes Measure Information System (PROMIS10) and HOOS JR survey at the preoperative baseline, 3-month post-operative, and 1-year post-operative time points. Patients with an American Society of Anesthesiologists (ASA) score greater than or equal to 4 or who did not complete follow-ups and surveys at each time points were excluded. Institutional review board at the institution of record found that this investigation to be exempt status. No funding was received for this study.
The HOOS JR consists of 40 items, scored from 0 to 100, where a score of 0 indicates the worst level of pain and functioning (Nilsdotter et al. 2003). Standard deviation (SD) and HOOS JR scores were calculated according to predetermined scoring algorithms for the HOOS JR outcome instrument as previously defined in the literature (Nilsdotter et al. 2003).
The MCID in this study was calculated at two time intervals, baseline to 3-months and baseline to 1-year, using both anchoring and distribution methods. The distribution method is widely used and assumes a normal response distribution among survey respondents (Berliner et al. 2016; Wyrwich et al. 2005; Chesworth et al. 2008; Norman, Sloan, and Wyrwich 2003; Quintana et al. 2005). It was calculated by halving the standard deviation of the change in preoperative (baseline) HOOS JR score to follow-up. The anchoring method utilizes an anchor question that adequately distinguishes patients with and without a change in their prior health state. Two anchor questions were selected from the PROMIS10 quality-of-life instrument. The PROMIS10 was chosen to provide anchoring questions as it has been shown to reliably measure patient-reported physical health and quality-of-life outcomes (Hays et al. 2009; Cella et al. 2007, 2010; Fidai et al. 2018). The first anchor question queried a patient’s interpretation of their overall physical health: “In general, how would you rate your physical health?” rated on a 5-point Likert scale (Poor, Fair, Good, Very Good, or Excellent). The second question queried a patient’s overall interpretation of their quality-of-life: “In general, would you say your quality-of-life is:” rated on the 5-point Likert scale.
The anchoring MCID for this study was calculated for patients who reported a one- or two-point increase for their respective anchoring questions (Tubach, Wells, et al. 2005; Tubach, Ravaud, et al. 2005). The anchoring MCID was subsequently averaged for each time interval from baseline to 3-months, and baseline to 1-year intervals. We report the average MCID with standard deviation. All analyses were conducted using STATA (SE version 15.0; StataCorp College Station, TX, USA).
Results
A total of 991 patients were reviewed with 514 (51.9%) meeting inclusion criteria (Table 1). Of these, 280 (54.47%) were female, and the average age was 66.2 years. Average HOOS JR scores at preoperative, 3-month, and 1-year follow-up were 52.5 ± 13.5, 79.3 ± 14.2, and 86.1 ± 14.5, respectively. This reflects a 3-month and 1-year change in HOOS JR scores of 26.8 and 33.6. For the physical health anchoring question, a total of 173 (33.7%) and 169 (32.9%) patients reported a one- or two-point increase at 3-months and 1-year time point intervals, respectively. For the quality-of-life anchoring question, a total of 200 (38.9%) and 217(42.2%) patients reported a one- or two-point increase at 3-month and 1-year time point intervals.
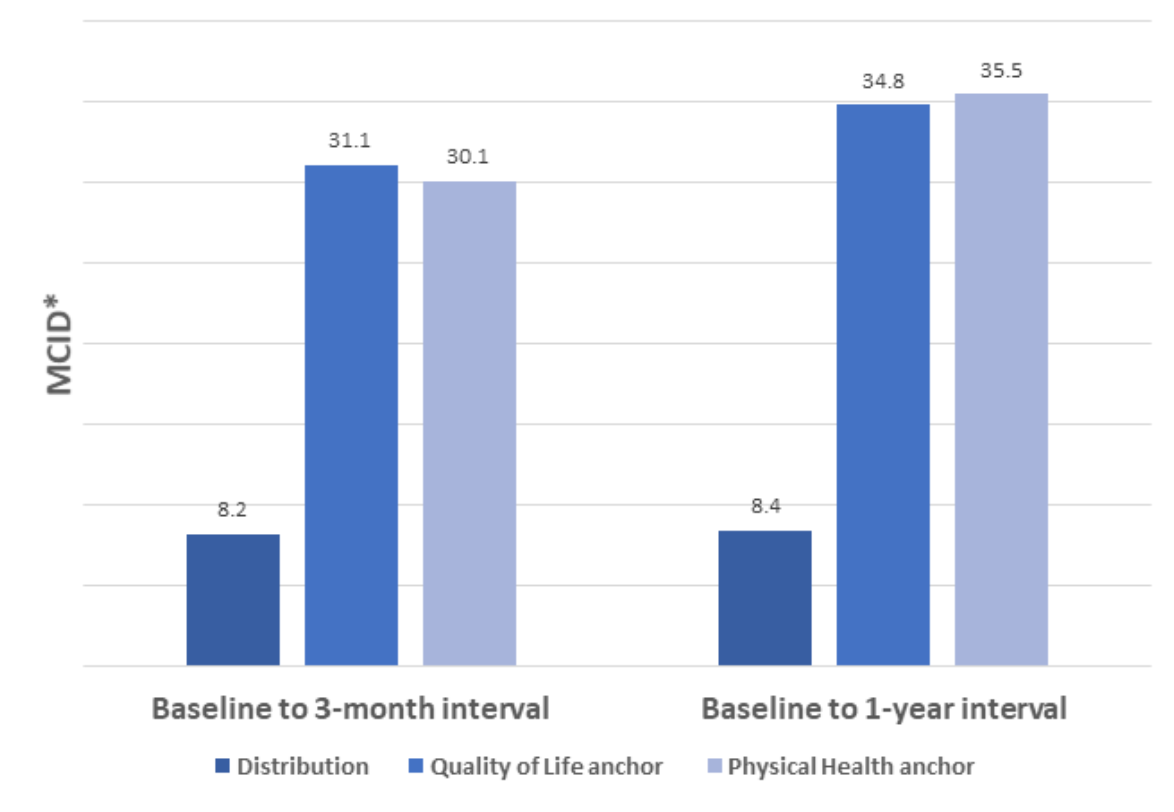
Based on the PROMIS10 physical health anchoring method, the HOOS JR MCID were 30.1 ± 15.1 and 35.5 ± 15.0 for the 3-month and 1-year time intervals (Figure 1). Similarly, for the PROMIS10 quality-of-life anchoring method, the HOOS JR MCID were 31.1 ± 14.6 and 34.8 ± 15.9 for the 3-month and 1-year time intervals, respectively. Using the distribution method, the MCID was 8.2 and 8.4 for the 3-month and 1-year intervals, respectively.

At the 3-month time point, 89.1% of patients achieved the distribution-based MCID (at least an 8.2-point increase), while only 41.4% of patients achieved the physical health anchor-based MCID (at least a 30.1-point increase), and 45.1% of patients achieved the quality-of-life anchor-based MCID (a minimum 31.1-point increase). At the 1-year time point, 93.6% of patients achieved the distribution-based MCID (minimum 8.4-point increase), 45.1% of patients achieved the physical health anchor-based MCID (minimum 35.5-point increase), and 49.6% of patients achieved the quality-of-life anchor-based MCID (a minimum 34.8-point increase).
Discussion
The efficacy of THA is well established, but there continues to be a need for a tool to accurately quantify and calculate meaningful clinical change perceived by patients following surgery. This study sought to determine the HOOS JR MCID at two time intervals and to evaluate different analytical methods for calculating the HOOS JR MCID for patients undergoing THA. Our study uniquely demonstrates that the HOOS JR MCID varies over time and by the analytical method used to determine the MCID. The anchoring method MCIDs were 30.1 ± 15.1 and 35.5 ± 15.0 at the 3 month and 1-year time points, respectively, using the PROMIS10 physical health anchor and 31.1 ± 14.6 and 34.8 ± 15.9 at the 3-month and 1-year time points, respectively, for the PROMIS10 quality-of-life anchor. The distribution-based MCID was 8.2 and 8.4 at the 3-month and 1-year time points, respectively.
There have been prior attempts to define the HOOS JR MCID. A study by Kuo et al. derived a distribution-based HOOS JR MCID value of 10.1 at 1-year follow-up in 271 patients undergoing THA at three Veterans Affairs Medical Centers (Kuo et al. 2020). This value is similar to the distribution-based MCID value found in our study at both the 3-month and 1-year time points (8.2 and 8.4, respectively). Lyman et al. used both anchor and distribution-based methods to calculate HOOS JR MCID values at 2-year follow-up in 2323 Medicare patients undergoing THA at a large, tertiary care center (Lyman et al. 2018). They found distribution-based MCID values of 7 and anchor-based values of 18. Our distribution-based MCID value was relatively close to theirs at both time intervals, while the anchor-based MCID value in our study was approximately twice theirs at both intervals. It is important to note that neither of these previous studies accounted for how MCID may be affected by patient response at different time points.
MCID has been shown in prior studies to vary depending on the follow up time point (Mills et al. 2016; McCreary et al. 2020; Jain et al. 2017). In one study examining the Patient-Rated Wrist Evaluation (PRWE) MCID, the MCID was shown to increase from 26.8 ± 24.7 at the 6-week time point to 42.6 ± 23.2 for the 12-week follow-up time point (McCreary et al. 2020). In a separate study examining MCID for the Knee injury and Osteoarthritis Outcome Score (KOOS), MCID varied at 26-week and 52-week time points on pain and quality-of-life subscales of the KOOS (Mills et al. 2016). These findings may be explained by MCIDs varying with changing patient expectations regarding their clinical improvement over time. As patients improve in their post-operative course, expectations for their rate of clinical and functional improvement will change as they return to their normal activities (Jain et al. 2017; Krushell et al. 2016; Conner-Spady et al. 2020). MCIDs may be less an inherent quality of a patient outcome instrument and more of a moving target that may be individualized for a patient or a group of patients with similar qualities. Clinicians should be aware of this change when utilizing PROs, like the HOOS JR, to counsel patients in pre-operative decision-making and post-operative expectations.
The current study also identified differences in MCID based on the analytical method used. The anchor-based method is advantageous because it is patient centric. PROMs are increasingly popular, and a method reliant on a PROM may be able to most accurately capture MCID for individual patients at different time points. However, the anchor-based method is limited by its dependence on the chosen anchoring question which is chosen by the surgeon or the assessor. A previous study showed choice of anchor question substantially affects MCID (de Vet et al. 2007). Lyman et al. calculated a MCID of 18 utilizing the quality of life (QOL) satisfaction item from the Hospital for Special Surgery (HSS) Satisfaction Survey as their anchor question at 2-years follow up (Lyman et al. 2018). At 3-months and 1-year follow up, our anchor-based MCID, utilizing PROMIS-10 questions as anchors, produced values almost twice than those obtained by Lyman et al. Our findings support the notion that anchor question selection influences MCID calculation. In contrast, distribution MCID values are mathematical constructs lacking a link back to the patient and their perception of recovery, thus predisposing this method to be less responsive to changes in PROMs over time as demonstrated in our study. MCIDs calculated using this methodology are sample-specific and not anchored to a quality-of-life measure. This may limit the generalizability of an MCID derived by this method. It is clear that MCID depends on methodology and both current methodologies have shortcomings. Furthermore, single MCID values are useful for evaluating patient outcomes at a single moment in time but imperfect at determining clinical improvement over time.
Our study identifies that MCID values are affected by time and calculation method. Given the possibility of MCID variance over time, it is critical to develop a method that reliably determines an MCID at any given point in a patient’s post-operative course. It may also be beneficial to evaluate additional time points to monitor patient’s perception on recovery over-time. Although analytical method selection has also been shown to impact the MCID, with previous literature suggesting differences between distribution- and anchor-based methods (Mills et al. 2016; McCreary et al. 2020; de Vet et al. 2007), there still remain unidentified factors influencing MCID values. The MCID for individuals with certain conditions may vary. For instance, the HOOS JR MCID for patients with BMIs >30 may be different from that of a group of patients with BMIs <30. Identification of specific patient factors (BMI, history of mental health illness, medical comorbidities, etc.) influencing MCID could lead to optimization of calculation methodologies and contribute to improved clinical decision-making before and after THA.
Over the past decade increasing scrutiny has been placed on understanding MCID in this context of applying PROMs into clinical decision-making. Utilizing PROMs in the pre-operative setting to engage in shared decision-making is one real world example for the application of MCID. Engaging patients pre-operatively regarding their current functional status and discussing what a clinically meaningful improvement would be in their HOOS JR score may provide useful information that allows providers to openly connect with patients and help them manage their expectations. Each patient will have different pre-operative PROM scores and goals, therefore meaning that no one MCID can adequately capture a “good outcome”. This further emphasizes that future work is needed to refine the MCID into more narrow cohorts, potentially even an individualized score with a large enough data set. Following patients throughout their post-operative recovery is another real world example that can benefit from application of MCID data. It is critical to understand that patient expectations and MCIDs change over time as they recover from surgery. Accurate MCID values over time provide an opportunity to use PROMs longitudinally to track this recovery analogous to a growth chart in pediatrics. While it should be mentioned that MCID does not represent a bright line equivalent to a “good outcome”, it can help in remotely monitoring large groups of patients and identifying those who need closer follow up or who are progressing as anticipated. Considering these potential benefits as well as how insurance companies are increasingly requiring PROMs for prior authorization, our study demonstrates that it is critical for our specialty to continue better understanding the relationship between pre-operative PROMs, MCIDs, and patient satisfaction. If not we will be at risk of having payors dictate which patients are eligible to undergo THA, thus imposing barriers to patients that may benefit from this procedure.
This study has multiple limitations. This study used data from a patient population in one metropolitan area. There is a lack of generalizability to other institutions and patient populations. Additionally, the data were collected from patients receiving THA from multiple different surgeons. It is possible that short- and long-term outcomes vary by surgeon, and a single surgeon study may have allowed for better assessment of patient outcomes. There are also limitations to calculating MCID. At present, there is no single best practice for choosing an anchoring tool and question for the purpose of calculating an anchoring method MCID. Further, we do not report other covariates of interest that may influence MCID calculations such as mental health. Finally, this study did not collect information on rehabilitation protocols which may result in variable patient recovery. Nevertheless, these limitations withstanding, this study demonstrates multiple strengths. We calculated the MCID using multiple analytical methods for multiple time points. The study also draws on a substantially large number of patients whose demographics are representative of those undergoing THA in the general population.
Conclusion
This is the first study to our knowledge to assess the MCID using both the distribution- and anchor-based analytical methods at multiple time points. MCID values vary by time and calculation method within the same population. THA patients may require individualized and time-point specific MCID formulas to better guide clinical decision-making.