Introduction
Osteoarthritis (OA) is a common debilitating disease in adults due to its high prevalence and disabling features. Internationally, the prevalence of OA increased from 250 million to 530 million between 1990 and 2019 (Long et al. 2022). This change represents a 113% increase in prevalence with only a 45% increase in population size (5.3 vs 7.7 billion). Experts attribute the rise in knee and hip OA diagnoses in the United States of America (USA) to an aging population and an increased prevalence of obesity (Pearson et al. 2017). Moreover, the rate of arthroplasty, the definitive treatment option for hip and knee OA, has doubled in the USA over the past decade (Hunter, Schofield, and Callander 2014).
Obesity is a prominent modifiable risk factor for the development of hip and knee OA. It drives the progression of the disease (Blagojevic et al. 2010; Grotle et al. 2008; Litwic et al. 2013; Murphy et al. 2008; Plotnikoff et al. 2015). Gersing et al. (2019) demonstrated that a reduction in body weight is associated with a slower rate of knee cartilage deterioration in patients with knee OA (Gersing et al. 2019). The multicenter Osteoarthritis Initiative found that in patients at high risk for clinically significant knee or hip OA, every 1% reduction in body weight reduced the risk of hip or knee replacement by 2% or 3%, respectively (Salis et al. 2022). Obesity leads to worse outcomes following arthroplasty, including long-term functional outcomes, overall satisfaction with the procedure (Lübbeke et al. 2007), infection rates, dislocations, and revisions (Onggo et al. 2020, 2021). This association highlights the impact obesity has on the conservative management of OA, as well as how it may prohibit surgical candidates from receiving arthroplasty because of obesity’s impact on the risk of adverse events postoperatively. Major medical organizations, including the American Academy of Orthopedic Surgeons, the American College of Rheumatology, and the European Alliance of Associations for Rheumatology, recommend weight loss interventions for managing knee OA in overweight or obese patients (Brophy and Fillingham 2022; Kolasinski et al. 2020; Moseng et al. 2024).
Dietary changes, exercise, pharmacotherapy, and surgery are standard treatments for managing obesity in patients with OA. Moreover, weight loss is an important early intervention for obese patients with OA. Lifestyle interventions centered on diet, exercise, or a combination proved efficacious in weight reduction, demonstrating a 5-9% body weight reduction at six months. This weight loss was sustained, with a 4.8-8% reduction from baseline weight at 12 months (Franz et al. 2007). Pharmacologic interventions aimed at weight loss are also effective, with orlistat and sibutramine demonstrating roughly 8% weight loss in the first six months (Franz et al. 2007). More recently, weekly subcutaneous injections of glucagon-like peptide 1 (GLP-1) receptor agonists led to 15% weight loss over 16 months in obese subjects (Wilding et al. 2021). Finally, bariatric surgical treatments for weight loss (e.g., Roux-en-Y gastric bypass) report an average loss of 31% of body weight one year following surgery (Maciejewski et al. 2016). While surgical treatments for weight management are likely to yield the most weight loss, they can be invasive and costly. In contrast, diet and exercise changes yield more modest weight reductions but are relatively cost-effective, improve other health measures, and do not interfere with other interventions.
Current practice guidelines for managing hip and knee OA recommend non-operative treatment, including weight loss, physical therapy (PT), and pharmacotherapy (Pharm) (Srivastava and AAOS Surgical Management of Osteoarthritis of the Knee Work Group 2023; Zhang et al. 2008). Despite being a universally recognized treatment for patients with OA, it is unknown what percentage of orthopedic specialists recommend weight loss interventions for obese patients diagnosed with OA of the hip or knee. As noted earlier in the introduction, effective weight loss interventions may prevent the progression of OA to arthroplasty (Salis et al. 2022) and reduce postoperative complications in patients who do receive arthroplasty (Lübbeke et al. 2007; Onggo et al. 2020, 2021). It is important to gain a quantitative understanding of the rate at which healthcare providers recommend weight loss in their treatment algorithms for the disease. Discovering irregularities in how frequently providers offer treatments highlights behaviors we can retrain in providers to improve patient outcomes. We hypothesize that providers offered weight loss treatments less often than pharmacotherapy or physical therapy.
Methods
Study Design and Patient Population
We conducted a retrospective single-center case series of adult patients (>18 years of age) with obesity (BMI ≥ 30 kg/m2) and OA of the hip and/or knee who visited a Joint Reconstruction or Sports Medicine division provider in the Vanderbilt University Medical Center Department of Orthopaedic Surgery. Patient visits were between November 2017 and April 2024. After approval from the Institutional Review Board (IRB #231890), the authors reviewed individual patient charts for weight loss instruction and other treatments for OA.
Exclusion criteria were patients with a BMI<30, visits in which the patient’s BMI was below 30 or if there was no recorded BMI within one month of the visit, encounters following referral for a total knee or hip arthroplasty, patients who previously had arthroplasty on the joint of interest, “injection-only” visits, and visits in which a provider offered WLI as part of presurgical optimization. We chose exclusion criteria to select patients and encounters without additional bias for or against the provision of comprehensive conservative treatments (e.g., excluding patients who may receive weight loss instruction solely to optimize them for surgery). Patient demographic and clinical data were obtained from an institutional deidentified dataset generated from the electronic medical record and stored securely in a REDCap database (Harris et al. 2009, 2019). Variables of interest included patient demographics, ICD-10 codes, weight-loss instruction, other non-operative interventions (e.g., PT and Pharm), the number of relevant visits, and specific therapies recommended for each clinic visit as documented in the clinic note. We also collected data on weight-bearing X-rays within one year of a medical visit.
We defined Weight Loss Instruction (WLI) as documentation of nonspecific weight-loss recommendations by the provider (e.g., “patient was informed they should lose weight.”), a specific consumer weight loss resource/strategy or recommendation or a documented weight loss plan the provider developed, a referral to a medical weight loss specialist, or a surgical weight loss specialist. We defined PT as a treatment in which a physician prescribes PT or documented treatment with a dedicated home exercise program. Pharm included continuing orders for prescription or over-the-counter analgesia/anti-inflammatories or a provision/plan for an injectable treatment in the office (e.g., steroid, viscoelastic, or orthobiologic injections).
Additionally, we subgrouped patients into one of three BMI ranges using the BMI at the first visit for OA (30-34.99, 35-39.99, 40+). Also, we stratified patients by time: the first visit before or after June 2021 to coincide with the FDA approval of semaglutide for weight loss indication. In total, there were six subgroups.
The original chart review yielded over 19,000 charts between November 2017 and April 2024 from 24 providers. Using a random sample of 30 charts to determine rates of WLI, PT, and Pharm, a doctoral-level biostatistician (JP) determined that a sample of 150 charts could determine a 20% difference between the rate of WLI from either PT or Pharm with power set at 0.8. To ensure that 150 charts from the pool of 19,000+ would provide data for patients in our BMI and time subgroups, we used block selection, creating cohorts of 25 patients in each of the six subgroups for 150 patients. We reviewed patient charts continuously until there were 25 independent patients in each of the six subgroups that satisfied the inclusion/exclusion criteria (Table 1). The investigators created and tested a data collection form a priori in Redcap. Two authors (BW and BH) performed data collection, and the senior author (LS) reviewed any discrepancies.
We evaluated if WLI was predictable due to differences in disease progression on weight-bearing x-rays of the hips and knees. Of the 150 patients and 299 eligible visits, 181 visits (v) were done within one year of a weight-bearing x-ray of the hips (v=19), knees (v=173), or both. X-rays were graded based on the Kellgren Lawrence (knees) and Tonnis (hip) grading system, subjective methods for evaluating osteophytosis/deformity, sclerosis, subchondral cysts, and joint space (Kovalenko, Bremjit, and Fernando 2018; Schiphof, Boers, and Bierma-Zeinstra 2008; Tönnis 1976). The senior author (LS), a Sports Medicine physician with over a decade of experience interpreting x-rays independently, applied normative data for joint space measurements (Lanyon et al. 1998; Anas et al. 2013) and precedent from past literature (Katz et al. 2013) to define Kellgren Lawrence 1 through 4 and Tonnis 1 through 3 (Table 2).
Outcomes
The primary outcome of interest was comparing the percentage of patients who received WLI to PT or Pharm. The secondary outcomes of interest were comparing the rates of WLI compared to PT and Pharm within subgroups, the rates of WLI between subgroups, and the relationships between WLI, BMI, and knee or hip OA grade on weight-bearing x-rays.
Statistical Analyses
The descriptive statistics for the patient demographics are published with comparisons between the independent subgroups using Pearson’s Chi-squared tests for categorical variables and Wilcoxon or Kruskal-Wallis rank sum tests for continuous variables. In all analyses, post-hoc pairwise comparisons were conducted when significant differences were seen across the three BMI groups, and the p-values were Bonferroni corrected.
The primary outcome was a paired comparison of the proportion of patients receiving WLI to PT and WLI to Pharm. We compared these proportions using McNemar tests with mid-P p-values and 95% confidence intervals and performed the same paired analysis within the three BMI and two date subgroups. We chose odds ratios to report estimates and confidence intervals for proportion differences. We replaced odds ratios that went to infinity with ∞.
The statistical analysis of the difference in the rates of specific interventions between unpaired BMI and date subgroups was measured with Pearson’s Chi-squared tests and Fisher’s exact tests. The authors used descriptive statistics to summarize which visit WLI, PT, or Pharm was first offered.
Lastly, the authors used mixed-effect logistic regression models with patient as a random effect to assess if WLI at each visit was predictable using visit BMI and x-ray progression. The models were planned to be run separately on visits for hip and knee OA. However, as none of the 19 visits for hip OA contained a WLI recommendation, only the results for knee OA visits are presented with KL Grade as the x-ray progression covariate.
Results
Table 1 summarizes patient demographics. The 30-34.99 BMI subgroup was significantly older compared to the 35-39.99 (p = 0.005) and 40+ subgroups (p = 0.006). Baseline BMI was significantly different across all BMI subgroups (all p’s < 0.0001). Patients with a first visit before 6/2021 returned for more visits compared to patients with a first visit after 6/2021 (p = 0.048).
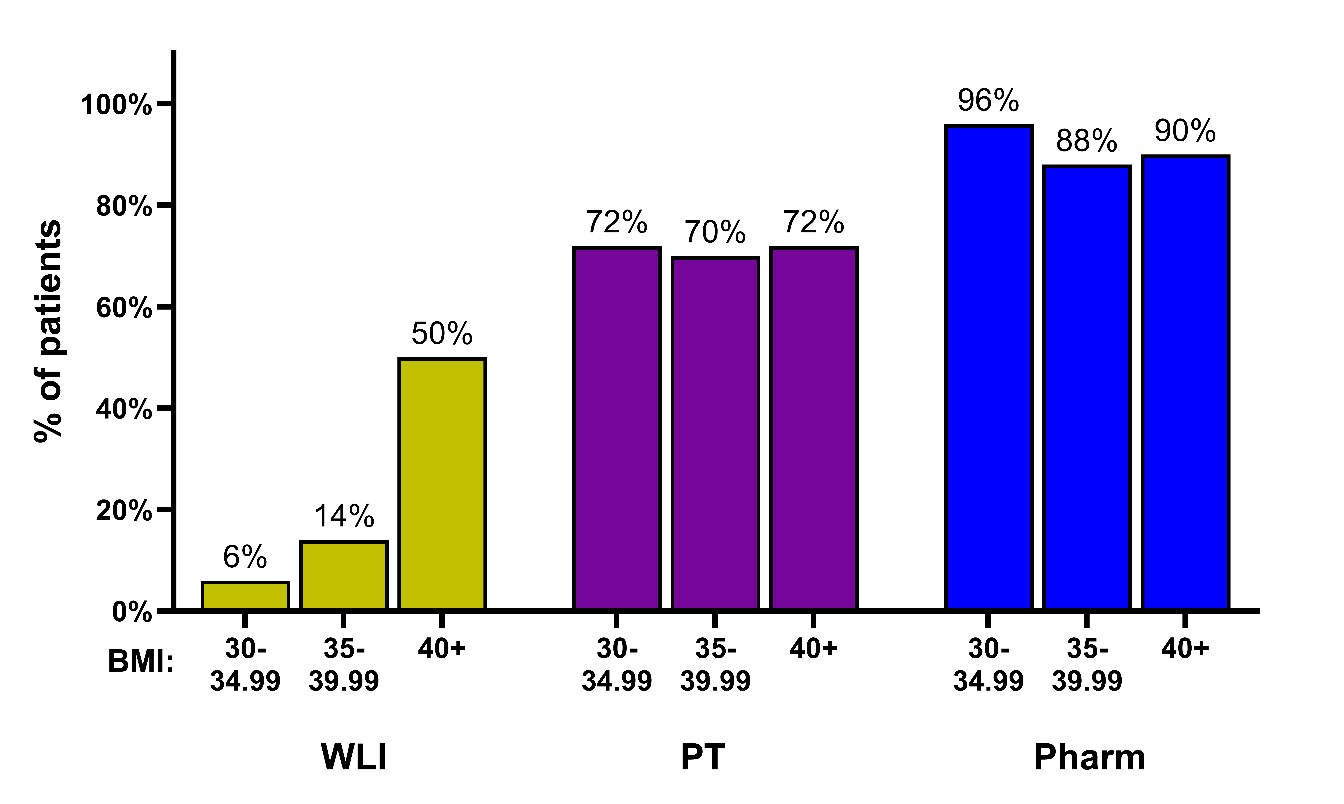
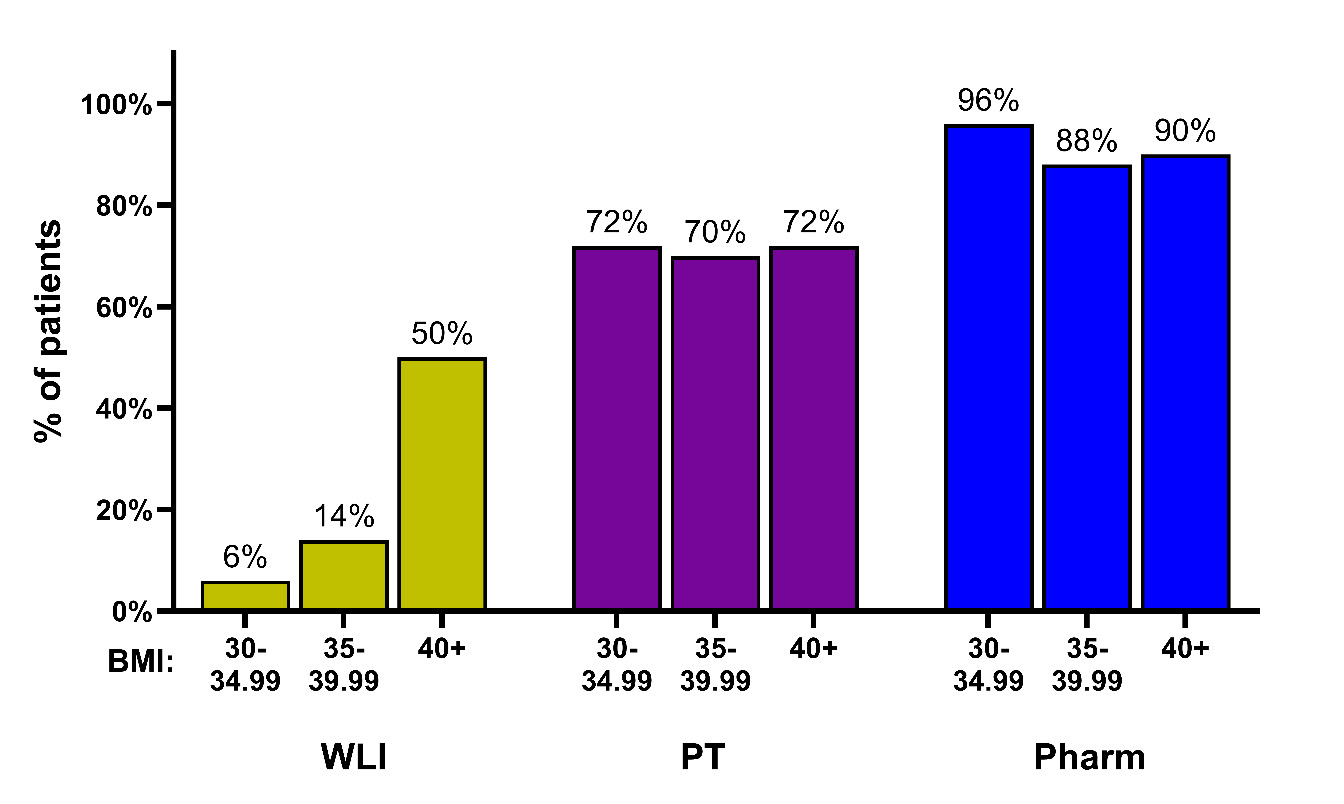
For the 150 participants in this study, we found that they were significantly more likely to be offered Pharm (91.33%, OR = 35.00, [CI: 12.57-139.56], p < 0.0001) and PT (71.33%, OR=15.40, [CI:6.69-43.09], p < 0.0001) compared to WLI (23.33%; Table 3).
Within each subgroup, a significantly greater percentage of patients received Pharm compared to WLI during any visit regardless of BMI subgroup (BMI 30-34.99: 96% vs 6%, OR = ∞, [CI: 14.52-∞], p < 0.0001; BMI 35-39.99: 88% vs 14%, OR = 38.00, [CI: 7.33-778.64], p < 0.0001; BMI 40+: 90% vs 50%, OR = 11.00, [CI: 3.02-69.21], p < 0.0001) and pre/post GLP1 agonist approval (Pre-6/2021: 92% vs 21.33%, OR = 54.00, [CI: 10.57-1098.40], p < 0.0001; Post-6/2021: 90.67% vs 25.33%, OR = 25.50, [CI: 7.40-155.60], p < 0.0001). A similar relationship existed between PT and WLI in the BMI subgroups (BMI 30-34.99: 72% vs 6%, OR = ∞, [CI: 10.52-∞], p < 0.0001; BMI 35-39.99: 70% vs 14%, OR = ∞, [CI: 8.86-∞], p < 0.0001; BMI 40+: 72% vs 50%, OR = 3.20, [CI:1.22-9.76], p=0.017) and before or after the approval of GLP1 agonists, p = 0.017; Pre-6/2021: 68% vs 21.33%, OR = 12.67, [CI: 4.37-51.84], p < 0.0001; Post-6/2021: 74.67% vs 25.33%, OR = 19.5, [CI: 5.58-120.31], p < 0.0001) (Table 3 and Figure 1).
When WLI, PT, or Pharm was offered, the providers most frequently (median) offered it during the first visit. In patients who received a recommendation for WLI, 80% were offered WLI at the first visit (PT 90.7% offered at the first visit, and Pharm 97.1% offered at the first visit).
WLI was offered significantly more often to BMI 40+ patients (50%) compared to BMI 30-34.99 (6%, OR = 15.23 [CI: 4.06 – 86.38], p < 0.0001) and BMI 35-39.99 (14%, OR = 6.02 [CI: 2.15 – 19.00], p = 0.0006) patients (overall p < 0.0001; Table 4). As patients who were offered multiple WLI types were always offered a nonspecific recommendation, the analysis of nonspecific recommendations is identical to the overall WLI analysis. Similarly, providers offered medical weight loss referrals significantly more often to BMI 40+ (16%) patients compared to BMI 30-34.99 (0%, OR = ∞, [CI: 1.88 - ∞], p = 0.017; overall p = 0.002).
Providers offered WLI, Pharm, and PT at similar rates before and after the approval of GLP-1 receptor agonists for weight loss (Table 5). Patients were offered prescription medication significantly more often Pre 6/2021 (45.33%) compared to Post 6/2021 (25.33%, OR = 2.43, [CI: 1.16-5.20], p = 0.016).
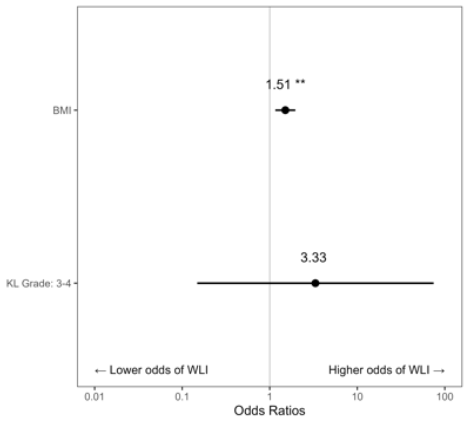
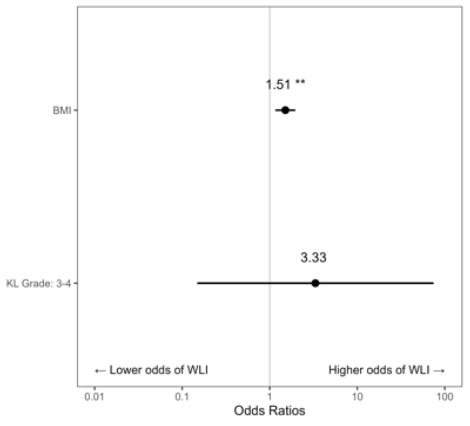
Across the 173 visits associated with knee OA, 20.2% of x-rays showed a KL Grade of 1, 11.0% Grade 2, 15.0% Grade 3, and 53.8% Grade 4. For analysis, KL Grade was combined into two categories (Grades 1-2, Grades 3-4). The average visit-level BMI was 40.6 (SD=7.5). There were 93 unique patients across the 173 visits, and the average number of visits per patient was 1.79 (SD=1.56). During patient visits for knee OA, higher BMI was associated with an increased likelihood of being offered WLI at each visit (OR = 1.51, [CI: 1.16-1.96], p = 0.002). A KL Grade of 3-4 was not a significant predictor of WLI when compared with a KL Grade of 1-2 (OR = 3.33, [CI: 0.15-74.50], p = 0.449) (Figure 2).
Discussion
While many studies have explored the importance of weight reduction for obese patients with hip or knee OA, this is the first study to examine the frequency of WLI for the treatment of knee and hip OA. The results support that WLI is offered significantly less frequently than PT and/or Pharm for the treatment of knee and hip OA (Table 3). When WLI was offered, providers generally offered it at the first visit, following a pattern similar to the provision of PT and Pharm. Given the defined benefit of WLI on patients with obesity and knee and/or hip OA, future investigation into the obstacles restricting WLI as an intervention for this patient population is warranted. Some hypotheses include difficult compliance with structured WLI, familiarity with Pharm, established relationships with PT providers, and undeveloped relationships with medical and surgical weight loss specialists.
We also evaluated the rate at which providers offered WLI, PT, and Pharm across BMI subgroups. Fifty percent of patients with a BMI of 40+ kg/m2 received WLI in this study. Twenty-eight percent of the time, it was nonspecific (e.g., “We discussed the importance of weight loss”). Nonspecific instruction is not included as a weight loss intervention in high-level studies like referrals to formal weight loss or structured weight loss programs (Miller et al. 2006; Jenkinson et al. 2009). Providers in this study offered structured weight loss programs or referrals to 22% of patients in the 40+ BMI subgroup.
Patients with a BMI of 40+ are higher-risk surgical candidates for either TKA or THA (Onggo et al. 2021, 2020). Hence, when prescribing WLI for these patients, providers may be utilizing WLI to optimize the surgical candidacy of patients rather than as a treatment for OA. Thus, we excluded records in which WLI was explicitly documented to make the patient a better surgical candidate and not as a holistic approach to the conservative care of patients with hip or knee OA. Even with these exclusions, patients with a BMI of 40+ were offered WLI more frequently than patients with a BMI of 30-39.99. One possible explanation for this is that patients with a BMI of 40+ may have more visible signs of obesity, reminding the provider to discuss WLI with this patient population. A second reason is that the 30-34.99 subgroup was significantly older in our data pull, and age may introduce a bias in the interventions providers may offer. Another possible explanation is that patients with a BMI of 40+ may have more severe degenerative disease. This is reasonable to consider because obesity is related to increased disease progression in hip and knee OA (Pearson et al. 2017; Plotnikoff et al. 2015; Blagojevic et al. 2010). However, advanced KL grade, KL Grade 3 or 4, was not a significant predictor of which patients received WLI compared to KL Grade 1 or 2 (Figure 2, OR = 3.33, [CI: 0.15-74.50], p = 0.449), There was a 51% increased probability that a provider would provide WLI for each point increase in BMI (Figure 2, OR = 1.51, [CI1.16-1.96]). There were insufficient visits with WLI instruction and x-rays for patients with hip osteoarthritis to predict the impact of advanced degenerative changes in the hip on the odds of receiving WLI.
GLP-1 receptor agonists have become a common treatment for weight loss. In June of 2021, the FDA approved semaglutide for weight loss in patients with obesity. Our subgroup analysis of patients before and after this date suggests that orthopaedic providers did not offer WLI more frequently after semaglutide approval (Table 5). However, this does not imply that other subspecialists did not write for semaglutide for these patients; it is just that orthopaedic providers did not document it as contributing to the hip and knee OA treatment plan.
Our study has limitations that should be acknowledged. First, we attempted to minimize confounding biases through inclusion/exclusion criteria to ensure an equitable count of patients and visits in which orthopaedic providers could offer WLI, PT, and Pharm. We also performed statistical analyses assuming that these choices were paired (e.g., providing one treatment may influence the offering of others).
To further investigate the influence of confounding, we planned a regression model that investigated if disease progression on X-rays impacted the treatments a provider offered. Other potential confounds we did not include were functional status, pain, or patient-reported outcomes. We plan to evaluate these areas in the future as providers record these measures more consistently.
Further, our study was performed using data from a single institution, which may influence the patterns of its providers. Standardized practice operations, familiarity with practical weight loss resources, institutional access to WLI (e.g., medical and surgical weight loss specialists), and clinical time constraints could underline some differences we found between WLI and PT or Pharm. Despite these differences, the frequency of WLI being offered was stark compared to Pharm or PT, suggesting the trend in provider practice might reflect trends within the field, like incentives for prescribing PT, injections, or prescription medication, and not be limited to the providers’ preferences at a single institution. Moreover, this study represented 24 unique physicians from two orthopedic surgery subspecialties.
Conclusion
Despite WLI being a recognized first-line intervention for obese patients with hip and knee OA, providers offer WLI less frequently than Pharm or PT. Providers offered WLI significantly more to patients with a BMI of 40+ kg/m2. There are opportunities for providers to offer structured WLI and referrals to medical and surgical weight loss specialists to improve clinical outcomes even prior to surgical optimization.
Funding
None.
Data Statement
Data associated with this article has been uploaded to the online Mendeley Data repository and can be found at:
Wong, Ben; Hou, Brian; Scott, Leon (2024), “Frequency of Weight Loss Instruction for Osteoarthritis,” Mendeley Data, V1, doi: 10.17632/kmtcr2n8yd.1