
Introduction
Cervical spondylosis is a prevalent condition in the population affecting roughly a quarter of the population under 40 years old, about half of those over 40, and up to 85% over 60 years old (Rao et al. 2007). Cervical spondylosis can progress to central canal stenosis potentially resulting in a variety of neurological symptoms including radiculopathy and myelopathy (Rao et al. 2007; Ronzi et al. 2018). These neurologic symptoms can be devastating to patients’ lifestyles and may be indications for surgical intervention (Kato and Fehlings 2016). There are several ways to diagnose cervical central canal (CCC) stenosis. Most frequently this is done using imaging modalities within the context of the clinical picture. Advanced imaging such as magnetic resonance imaging (MRI), and computed tomography (CT) are used to assess anteroposterior diameter (APD), interpedicular distance (IPD), and central canal area (Bajwa et al. 2012). These measurements guide CCC diagnosis by providing quantitative values.
Artificial intelligence (AI) has been a promising tool that has facilitated many advancements within the field of medicine. The implementation of AI in radiologic interpretations holds significant promise, particularly because it can expedite the reading of radiographic scans (Shin et al. 2023; Müller et al. 2022). There are several ways in which AI can be incorporated into the assessment of patients with CCC stenosis. First, it is possible to directly assess the central canal area through AI (Gaonkar et al. 2019). However, training AI to measure an inconsistent and irregular shape, such as a stenotic central cervical canal, can be quite burdensome and susceptible to multiple sources of error (Gaonkar et al. 2019; Lee 2006). A solution to this predicament has been proposed and tested for both the lumbar and cervical spine (Brandt et al. 2023, 2024).
In a discussion by Brandt et al., the APD, and IPD were used to calculate the area of various shapes to approximate the CCC area. The approximation used three shapes, an ellipse, a rectangle, and a triangle. The original premise for this methodology was due to AI demonstrating incredible accuracy in linear measurements with accuracy rates of up to 98.96 percent (Jiang et al. 2022). Practically, this level of accuracy serves as a solid foundation on which an approximation could be developed. Although the functionality of these shape approximations was limited, they did pave the way to the development of second-order approximations (SOA) that did not statistically differ from manual measurements (Brandt et al. 2024).
There are two endpoints to this study. First, assess the accuracy of the ellipse, rectangle, and triangle approximation for stenotic central canals at levels C2-C7. Secondly, to externally validate SOAs previously described by Brandt et. al for a non-stenotic CCC (Brandt et al. 2024). Before implementing AI within this process, it is necessary to assess the accuracy of the shape approximations and the SOAs in patients with stenosis of the CCC.
Methods
The authors conducted a comprehensive review of medical and radiographic records of patients aged 18 to 100 years. 334 patients had undergone CT C Spine imaging (GE Discovery 750 HD 64-slice CT scanner), either with or without contrast, from January 2015 to March 2023. Patients were pulled from a single tertiary referral center and used the Enterprise Imaging 8.3.x platform picture archiving and communication system (AGFA HealthCare, 2023, Mortsel, Belgium). Potential participants were systematically evaluated in order of completed imaging. Inclusion criteria involved the presence of radiologist-described mild, moderate, or severe central canal stenosis, as indicated in the associated radiologist reports for each observed scan. There are several ways in which the radiologist determines the presence of central canal stenosis. The greatest consensus is described in the lumbar spine literature. A radiologist reports mild stenosis if less than one-third of the canal is compromised, moderate if it’s between one and two-thirds, and severe if more than two-thirds of the spine is involved (Fardon et al. 2014). Alternatively, the Lee grading system takes a more qualitative approach to measuring lumbar spine stenosis and states that grading is dependent on the degree of CSF space obliteration and cauda equina clumping (Seo and Lee 2023).
Central canal stenosis could occur at more than one cervical spine level. Exclusion criteria encompassed individuals with a history of scoliosis featuring a coronal deformity exceeding 10 degrees, congenital abnormalities, traumatic spinal injury, infection, malignancy, existing spinal hardware, or prior spinal surgery. The reason for such exclusion criteria was to limit pathology exhibited by patients to degenerative, age-related changes of the CCC.
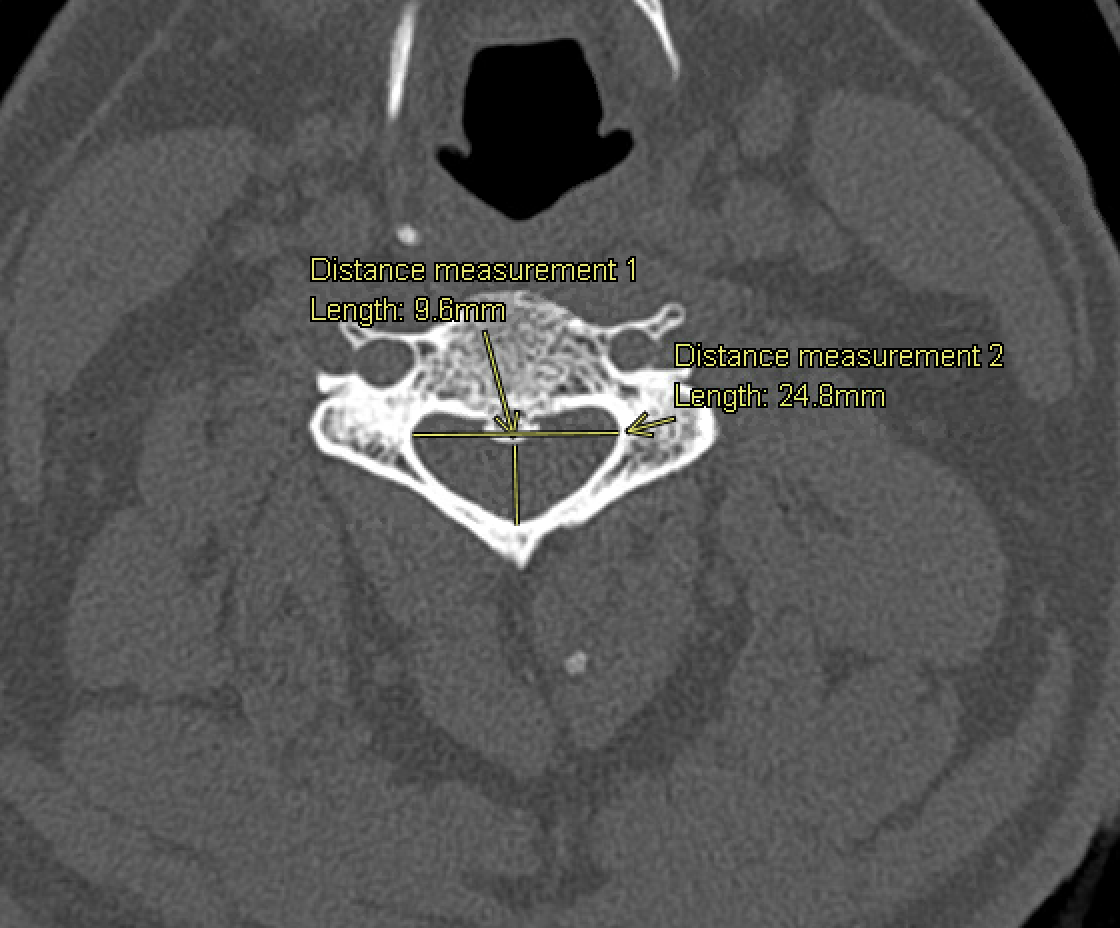
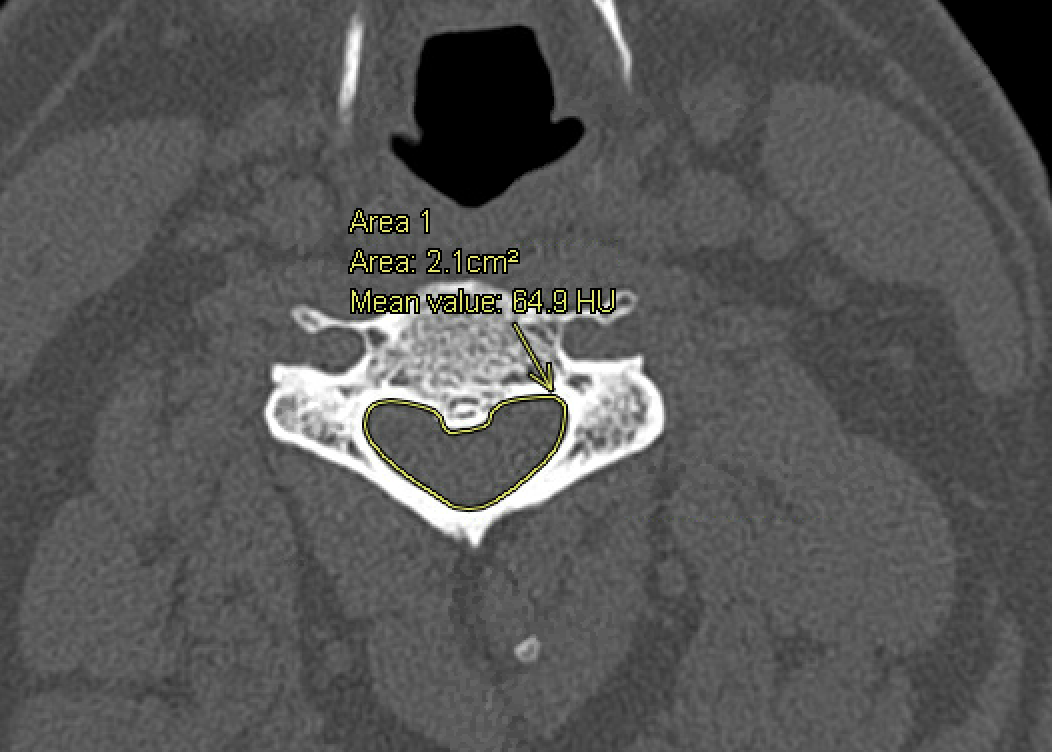
IPD, APD, and spinal canal area were assessed in patients who met inclusion criteria. Window and level specifications of 2,000 Hounsfield Unit (HU) and 500 HU were applied, respectively. Figure 1 demonstrates the evaluation of APD and IPD, while Figure 2 portrays the CCC area. APD was defined as the anterior-to-posterior distance at the midline of the central canal. IPD was defined as the maximum distance between the medial aspect of the pedicles at a specific vertebral level. The canal area was manually measured using the AGFA Enterprise Imaging markup freeform tool. Subsequently, an estimated area of the CCC was calculated using elliptical, triangular, and rectangular approximations. This was conducted using Equations 1-3 respectively. Equations 4 - 8 were used to apply SOAs developed from patients without the diagnosis of CCC stenosis. All equations are depicted in Figure 3.
_and_ipd_(distance_measurem.png)


Statistical analysis
All statistical analysis was conducted on SPSS version 28 (IBM Corporation, 2021, Armonk, NY, USA) alpha defined as p < 0.05. Normality and homogeneity of data were calculated using Kolmogorov-Smirnov tests and Q-Q plots followed by Levene’s homogeneity of variance test and regression residual plots, respectively. Descriptive statistics include average values and standard deviations. Mean differences and percent error from manual measurements were calculated to assess approximation accuracy. In addition, a paired sample T-test was conducted to assess for statistical differences between the manual measurements and approximated values. Last, a Pearson correlation coefficient was calculated between approximated and manual measurements. All statistical analysis was only conducted on levels that were defined as stenotic.
Results
There was a total of 118 patients who met inclusion criteria for a total of 239 stenotic levels. The patient cohort had a mean age of 64.3 years, with an even gender distribution (49.1% male, 50.9% female) and diverse racial representation (53.5% Caucasian, 31.6% Hispanic/Latino, 6.1% African American/Black, and 8.8% Asian).
The authors’ manual measurements revealed that the average area of the spinal canal ranged from 255.00 mm² at C2-3 to 294.29 mm² at C6-7. The mean area for the manual measurements increased consistently as the levels moved caudally. Detailed average areas for each cervical vertebrae are provided in Table 1. Among the shape approximations, the ellipse exhibited the closest approximation to the spinal canal area, with mean differences ranging from -2.95 mm² at C5-6 to -36.03 mm² at C2-3. The rectangle calculation showed the second most accurate approximation, with mean differences ranging from 23.80 mm² at C2-3 to 74.90 mm² at C5-6. The triangular approximation displayed the highest mean differences, ranging from –104.67 mm² at C4-5 to –115.60 mm² at C2-3. Similar to the manual measurements, each approximation had a replicated trend of increasing area while moving caudally. Among the shape approximations, the ellipse approximation was not statistically different from the manual measurements at levels C4-5 through C6-7. The rest of the approximations were statistically significant (p<0.05), as depicted in Table 2.
The ellipse approximation exhibited the lowest percent error for all levels except for C2-3, where it was surpassed in accuracy by the rectangular approximation. The ellipse approximation ranged from -14.14% at C2-3 to -1.02% at C5-6. The rectangular approximation emerged as the second most accurate, with percent errors ranging from 26.02% at C5-6 to 9.30% at C2-3. Lastly, the triangular approximation displayed percentage errors ranging from -45.33% at C2-3 to -36.99% at C5-6. Complete percent error values are provided in Table 3.
The shape approximations and SOAs ranged from highly to moderately correlated with the authors’ manual measurements. Approximations at the C2-3 vertebrae were highest with a correlation of 0.877 followed by all approximations at C3-4 with a value of 0.678. Approximations were least correlated with the C6-7 vertebrae with a value of 0.575. Correlation values decreased steadily as measurements moved caudally. All correlation values are in Table 2.
SOAs were computed for each level. Similar to other approximations, the mean area generally increased for more caudal levels. All values are available in Table 1. The percent difference for the SOA ranged from -6.37% at C3 to -0.16% at C6-7. The SOA was more accurate than any shape approximation in all levels except for C5-6. Percent difference data is available in Table 3. At C6-7, the SOA proved to be the most accurate, with a mean difference of 0.46 mm², whereas at C2-3, it demonstrated the least accuracy, with a mean difference of -16.26 mm². Importantly, at levels C3-4 to C6-7, no statistically significant difference was detected when compared to manual measurements (p>0.05). SOA mean difference, p-value, and correlation are available in Table 2.
Discussion
This study had two primary objectives. Initially, it sought to assess the effectiveness of elliptical, triangular, and rectangular approximations in patients with CCC stenosis. Subsequently, it aimed to externally validate previously described SOAs (Brandt et al. 2024).
The decision to utilize a two-linear measurement approximation was informed by the precision observed in previous studies on AI anatomical approximations (Jiang et al. 2022; Nakarai et al. 2023; Vogt et al. 2024). As these studies demonstrated the accuracy of AI in generating precise linear measurements, this study is centered around leveraging this capability to create an accurate approximation of the spinal canal area. The linear measurements of APD and IPD facilitated the computation of various shapes. The selection of shapes for approximation was guided by two factors: existing literature describing the spinal canal’s shape and the ability of shapes to consistently either overestimate or underestimate area, thereby enhancing the practicality of an SOA (Saker et al. 2016; Zarzur 1996). The effectiveness of the authors’ approximation of the spinal canal is influenced by several factors. Key considerations for evaluating this approximation include the mean difference of each approximation, percentage error, correlation values, and the presence of any statistically significant difference between the approximation and manual measurements.
When assessing the three shape approximations—ellipse, triangle, and rectangle—consistent mean differences were observed compared to manual measurements at each level, based on shape. The ellipse approximation demonstrated the highest accuracy across all levels except for C2-3, consistently underestimating the canal area. The elliptical mean difference increased in accuracy as it progressed caudally, until level C6-7 when a slight increase in inaccuracy from -2.95 mm² to -8.12 mm² was noted. This demonstrates a generalized trend toward a more elliptical shape of the central canal while moving caudally which is supported by previous studies [16.18]. The rectangle approximation, the second most accurate, showed opposite trends as it consistently overestimated the spinal canal area and decreased in accuracy as it moved caudally. The rectangular approximation’s highest accuracy was at the cephalic end of the cervical spine, specifically at C2-3 where it outperformed the ellipse approximation. Although there are several potential reasons why the rectangle approximation would outperform the ellipse approximation in stenotic cervical canals, one reason is a low sample size. With only nine of our studied patients experiencing stenosis at C2-3, this difference may be due to a low sample. This is consistent with current literature, as stenosis at higher cervical spine levels is less common than at lower levels (Chau, Wong, and Mobbs 2009). Finally, the triangle approximation emerged as the least accurate among all the approximations. It demonstrated its highest accuracy at the C4-5 level but its lowest accuracy at C2-3, without showing a consistent pattern from cranial to caudal levels. This inconsistency supports the cervical spine’s lack of a distinct triangular pattern, which is observed in the lumbar spine, particularly evident as it descends caudally (Bozkurt, Kaya, and Oztoprak 2017). All mean difference values for the shape approximations can be observed in Table 1.
The second method of evaluation for our shape approximations revolves around the percentage error of each approximation. The accuracy when defined by the percentage error exhibits similar trends as the mean difference for each approximation. The ellipse approximation was the most accurate followed by the rectangle approximation and lastly the triangular approximation. The greatest error for both the elliptical and triangular approximations existed in C2-3. In contrast, the rectangle approximation was most accurate at C2-3. The elliptical approximation had the lowest percentage error for levels C3-4 through C6-7 when compared with the triangular and rectangular approximations. The percentage error for the elliptical approximation in stenotic cervical central canals is quite low when compared to other sources of error. The highest level of error existed in C2-3 with a value of -14.14% with a low of -1.02% at C5-6. Intrinsic errors in imaging can revolve around +/- 6% due to factors such as partial volume effect, beam hardening, machine calibration, and spatial resolution (Ullrich et al. 1980). Additional studies have demonstrated errors in measurements that range from -8.46% (underestimation) to 5.21% (overestimation) which the ellipse approximation undercuts at several levels (Rokn et al. 2016). The percentage errors for the rectangle and triangle approximation are not nearly as accurate. The triangle approximation loses viability with percent error values ranging from -36.66% to -45.33%. The rectangle approximation is also considered to be inaccurate with percent error always above 9% and exceeding 20% for levels C4-5 through C6-7. However, the rectangle approximation consistently overestimates the value of the cervical central canal area leading to utility in a SOA. All values for percentage error can be observed in Table 3.
When assessing the correlation values for each shape approximation, it becomes evident that the correlation remains consistent across the different approximations, instead varying by cervical spinal level. This consistency arises due to all approximations relying on the APD and IPD measurements at each cervical spinal level. Correlation levels are predominantly moderate across most levels, ranging from C3-4 to C6-7, with a notably high correlation observed at C2-3. Detailed values for the correlation of shape approximations and SOAs can be found in Table 2.
The next step in evaluating the authors’ shape approximations is via statistical analysis. Statistical analysis of approximations acts as an assessment of the approximation’s utility in patients. Based on results from Brandt et al., it was expected that all of the shape approximations would be statistically different (p<0.05) (Brandt et al. 2024). However, there was no statistical difference between the ellipse approximation and the manual measurements for patients with central canal stenosis at levels C4-5, C5-6, or C6-7. The ellipse approximation was the only approximation to have such success as the triangle and rectangle approximations were both statistically different from manual measurements at all levels (p<0.05). As no shape approximation approximated the area of the canal with no statistical difference at all levels, the authors decided to test the previously developed SOA. All p-values for each approximation at each level are available in Table 2.
SOAs are a mathematical tool used in a variety of fields. This can range from physical chemistry and engineering to economics and finance (Barnett 1983; Yang and Manning 1996; Christiansen, Koch, and Jørgensen 1995). There is some inconsistency in the definition of a SOA due to the broad utility of the concept. In this study, the definition of a SOA is the use of one or more functions to generate a secondary combination function. In our case, these functions are the previously derived shape approximations. Similarly, this study uses previously derived combinations of shape approximations that use the full value of the ellipse approximation and a proportion of the rectangle approximation depending on the cervical spine level. This was done due to the underestimation of the ellipse approximation and the overestimation of the rectangle approximation which is still true within this study (Brandt et al. 2024). Equations of the SOA are Equations 4-8 within Figure 3. The SOAs were evaluated in the same manner as the shape approximations. First, the mean differences of SOAs were lowest compared to other approximations. The SOA was most accurate at C6-7 with a value of -0.46 mm² and least accurate at C2-3 with a value of -16.26 mm². All mean difference values for SOA are available in Table 2. A similar phenomenon was observed for the percent error, as at all levels except C5-6 the SOA was most accurate compared to the shape approximations. The SOA was least accurate at C2-3 with a percent error of 6.37% and most accurate at C6-7 with error of -0.16%. At each level, including C2-3 where it was least accurate, the SOA has percent error values low enough to be clinically relevant (Ullrich et al. 1980; Rokn et al. 2016). Subsequent evaluation of the SOA focuses on correlation values, which are dependent on levels rather than approximations as discussed earlier. Lastly, the SOA was evaluated on the statistical difference from manual measurements. In all levels except C2-3, the SOA did not exhibit a statistically significant difference from the manual measurements (p<0.05). An approximation that does not statistically differ from gold-standard measurements has huge clinical implications as the implementation of this approximation could be done with confidence.
Research has shown that integrating AI-based tools into healthcare practices has significantly enhanced patient care and contributed to substantial progress in the healthcare sector (Davenport and Kalakota 2019; Hryciw et al. 2023). This implementation spans various aspects, from improving physician-patient interactions to the assessment and management of critically ill patients (Hryciw et al. 2023; Saqib et al. 2023). Many studies have demonstrated significant success with careful implementation. One objective of this study is to advocate for the adoption of the derived SOA into clinical practice. These approximations have demonstrated effectiveness in patients without stenosis (Brandt et al. 2024). Additionally, this study has externally validated the previously derived approximations using a dataset of patients with radiologist-described CCC stenosis. Should an effective method be developed to train AI in measuring APD and IPD, these approximations could seamlessly integrate into clinical imaging modalities. This study, along with previous studies utilizing linear spine measurements, has successfully demonstrated potential, highlighting broader applications beyond CCC stenosis (Nakarai et al. 2023; Vogt et al. 2024). The successful application of these approximations could lead to AI-driven diagnostic tools that expedite and standardize the assessment of CCC stenosis.
Limitations
This study has several limitations that need consideration. First, the sample size of patients was limited due to those receiving specific imaging and radiologic interpretations. This limited sample size resulted in patients being lumped into the binary categories of positive or negative CCC stenosis. The additional granularity of approximation accuracy across the severity of CCC radiologic diagnosis was not calculated due to loss of power. However, the focus of this study was the utility of approximations in patients with CCC stenosis, regardless of severity, which was investigated. Additionally, the findings may not apply to patients who fall outside the exclusion criteria employed in this research such as patients with congenital malformations or previous spinal surgery. Furthermore, measurements were obtained by multiple observers, potentially introducing additional errors in the approximations. Despite these limitations, this study provides clear evidence of the effectiveness of the elliptical approximation and SOA in assessing the CCC area.
Conclusion
This study was conducted to evaluate two main points. First, the evaluation of shape approximations based on IPD and APD in patients with CCC stenosis. Secondly, it was to externally validate previously described SOAs by testing these approximations in patients with radiologist-described CCC stenosis. This study demonstrated the utility of elliptical approximations in accurately assessing the CCC area in patients with CCC stenosis from levels C4-5 to C6-7. Within this same population, SOAs proved to have utility in approximating the CCC area from C3-4-C6-7. The next step of this research is to apply the equations to an AI-based model and implement them in clinical practice.