


Introduction
Although pediatric pelvic fractures only account for 0.5-7.0% of pediatric fractures, they are associated with significant morbidity, with reported mortality ranging anywhere from 1.4-25% (Galos and Doering 2020; Shore et al. 2012; Marmor et al. 2015; Gänsslen, Heidari, and Weinberg 2012). Due to the elastic nature of the pediatric pelvis, high-energy injuries often lead to plastic deformation in addition to fracture, and these patterns of injury may not fall neatly into established classifications (Ridder and Olson 2019). Previous studies suggest that post-traumatic asymmetry does not remodel, even in younger patients (Smith 2005), and these findings have influenced more aggressive operative treatment of pediatric pelvic fractures. However, plastic deformation is difficult to correct operatively and may lead to residual asymmetry even with surgical treatment. Asymmetry of greater than 1.1 cm has been associated with functional disability at medium-term follow-up, and patients with a history of pelvic ring injuries show a significant decrease in physical functioning and overall quality of life (Smith 2005; Banierink et al. 2019; Dienstknecht et al. 2013).
While plain radiographs are most commonly used to assess pelvic injuries both pre-and post-operatively, computed tomography (CT) provides a more comprehensive understanding of injury patterns. However, CT scans are still visualized in two dimensions, making it difficult for the viewer to spatially orient the structures on the screen. Healthy adult populations have utilized 3-Dimensional (3D) imaging to demonstrate that 3D geometric symmetry is present in specific anatomic regions even though pelvic asymmetry exists, implying that the restoration of 3D symmetry of specific anatomic regions is more desirable than restoring pelvic ring symmetry (Zhang et al. 2022). However, the plastic nature of the pediatric pelvis and the lack of application of 3D imaging to this population leave many questions about the pediatric pelvis. Understanding how the pediatric pelvis matures or measures at each of these stages has not been analyzed in the 3D space.
3D CT has been reported previously in the orthopedic literature (Ead, Duke, et al. 2020; Zhang et al. 2022; Kim and Wenger 1997), but to our knowledge, this technology has not been applied to pediatric trauma patients. Understanding the three-dimensional patterns of injury, post-operative morphology, and extent of residual asymmetry is the first step in applying modeling technology to guide treatment decisions, provide prognostic information to patients and families, and potentially inspire alternative surgical techniques for improved management of these devastating injuries. This pilot study sought to establish a foundation for the applications of this technology in the pediatric pelvic trauma population, assessing both its benefits and feasibility.
Methods
A single center, IRB approved retrospective study at a quaternary care pediatric hospital identified all patients between 1 and 15 years of age treated for traumatic pelvic ring or acetabular fractures between January 2010 and December 2020. From the 188 patients included, two cases with pre- and post-operative CT scans were selected for this pilot study based on the severity of their injuries and skeletal immaturity. These patients had pre-operative CT images taken at outside hospitals prior to transfer and treatment, and post-operative scans conducted to assess alignment and hardware placement per standard care.
For patient 1 (9 year old female), pre-operative scans were taken by an outside consultant in a GE LightSpeed 16 Slice CT Scanner. Post-operative scans were taken using a Siemens SOMATOM Sensation 40 CT Scanner. Both image sets had a slice thickness of 3mm. Pre-operative scan pixel dimensions were 0.703125mm x 0.703125mm x 0.703125mm and post-operative scan pixel dimensions were 0.5703125mm x 0.5703125mm x 0.5703125mm.
For patient 2 (12 year old male), pre-operative scans were taken by an outside consultant in a GE LightSpeed 16 Slice CT Scanner. Post-operative scans were taken using a Siemens SOMATOM Sensation 40 CT Scanner. Both image sets had a slice thickness of 3mm. Pre-operative scan pixel dimensions were 0.7109375mm x 0.7109375mm x 3.00000mm and post-operative scan pixel dimensions were 0.678mm x 0.678mm x 0.500mm 3D Slicer was used for segmentation.
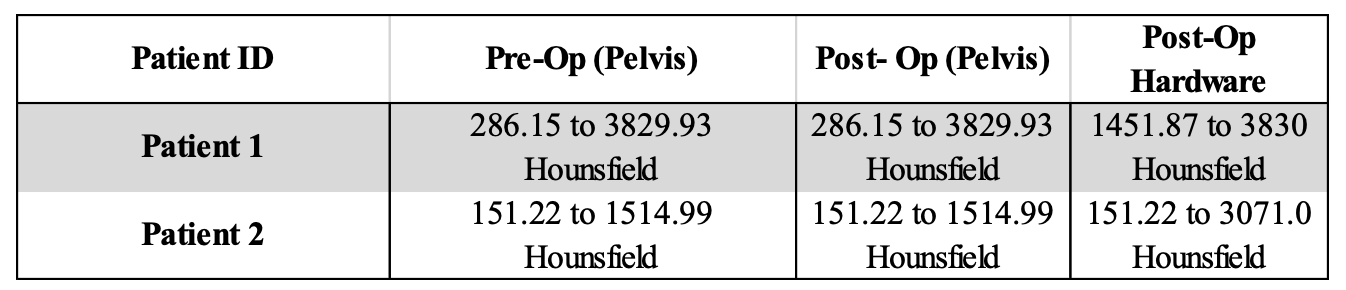
Both scans from both patients were uploaded to DICOM. The pre-operative study was selected from the DICOM database, which included four series. The ABD/PEL WITH series was loaded into the 3D Slicer software. Once volume information was reviewed, isotopic spacing was enabled. As the study series included both abdomen and pelvis, the volume was cropped to encompass the pelvic region. Under the volume rendering module, the new cropped volume was selected. In the “Display” module, the CT-AAA preset was used. Under the segment editor module, a new segmentation was created using the cropped volume as the “Master volume” and each pelvis was renamed. A threshold with a range, as seen in Table 1, was used for each pelvis.

Once the threshold was applied, the segmentation was visualized in 3D. Using the islands tool, small islands, with a minimum size of 1000 voxels, were removed. In the 3D viewer, mesh islands that were not part of the sacrum, coccyx, or right or left OS coxae were removed using the “remove selected island” tool. Once complete, the smoothing module was used with Median smoothing method and kernel size of 3.00mm (3x3x1 pixel) and applied to all segments. An additional segmentation was added, followed by the same steps used for the post-operative scan to segment out the pelvis as well as the hardware placed during surgery. Different Hounsfield units were needed for thresholding the surgical hardware than for bone due to the relative higher density of surgical hardware (stainless steel) to bone.
From Slicer, both pre-operative and post-operative segmentations were exported as WaveFront OBJ files and imported into Autodesk Maya. For both objects, under Modify, Center pivot tool was selected to ensure that the move tool was moving relative to the center of the object. Both objects were scaled in their respective Channel Box/Layer Editor to 0.072 in X, Y, and Z. This ensured that the pre-operative and post-operative pelves were the same size. Then, using the three orthographic views, both pelves were moved onto the workspace plane, and using the Snap Align Objects tool, the two meshes were aligned in all three planes (X, Y, and Z) to the selection average with the “Mid” mode.
Once the pelves were aligned, two different lambert materials were created in the Hypershade guide and applied to the pre-operative and post-operative meshes, with different but visually complimentary shades used. Then, the transparency of the material was increased under common material attributes for the pre-operative mesh, allowing for visualization of where the two meshes were both overlapping and differing morphologically.
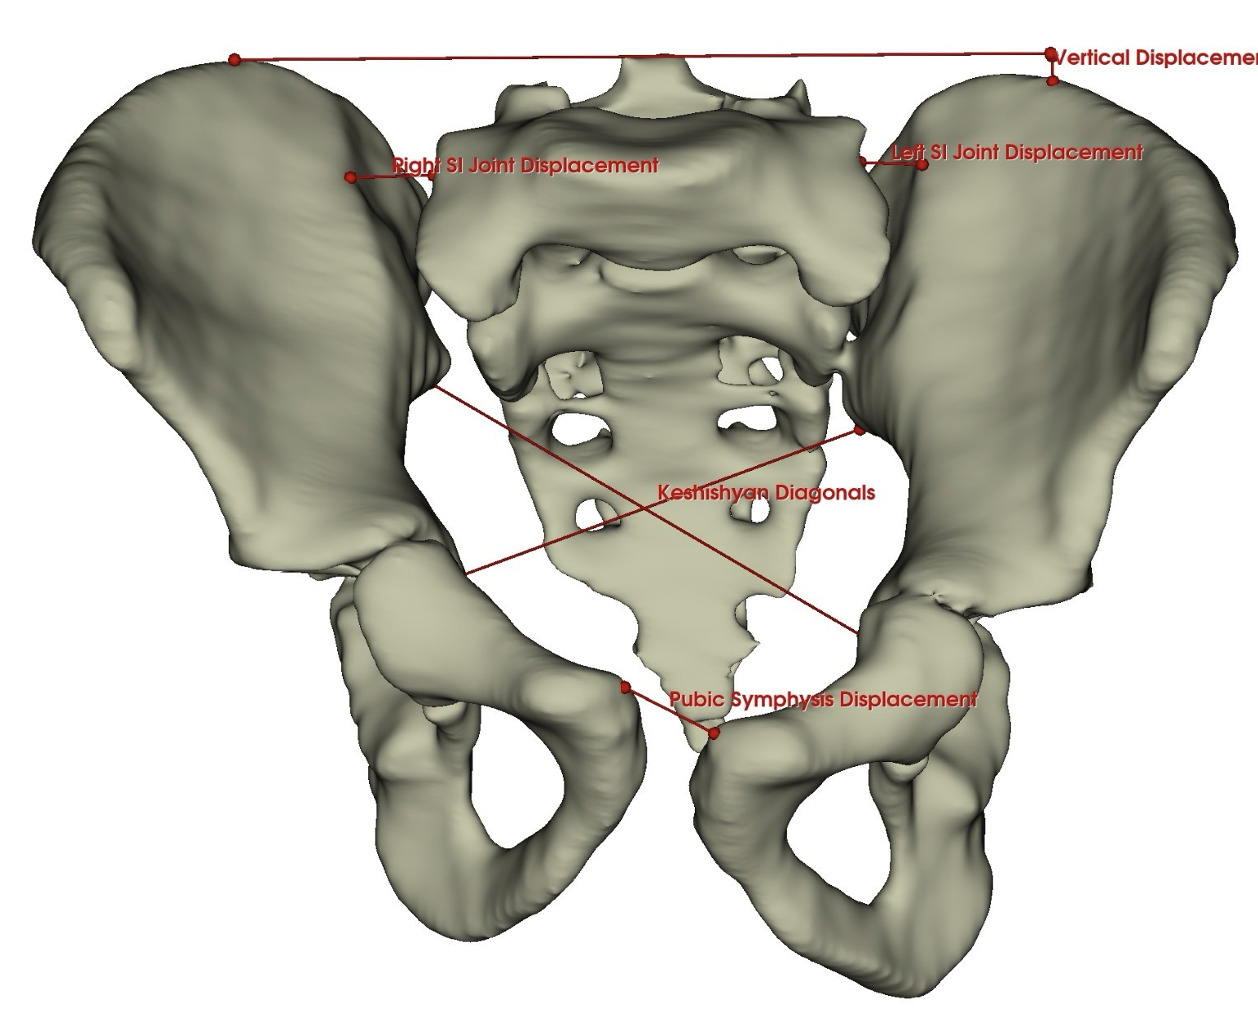
The landmarks used to measure deformity were maximum sacroiliac (SI) joint displacement, maximum displacement of pubic symphysis, and maximum vertical displacement of the injured ilium (Smith 2005; Matta and Tornetta 1996; Sagi et al. 2009). These measurements were made on traditional radiographs and CT scans using PACS and in 3D Slicer using dropped points (Figure 1). In the 3D models, the SI joint diastasis was measured from the lateral-most boundary of the ala of the sacrum to the internal surface of the ilium at the S1 spinal level. Pubic symphysis displacement was measured between the superior portion of the symphyseal surface of the right and left pubis. To determine vertical displacement, a line parallel to the sacrum was extended from the intact hemipelvis, followed by a perpendicular line spanning from the first line to the most superior point of the more displaced hemipelvis. For asymmetry, a modification of the Keshishyan index (Keshishyan et al. 1995; Lefaivre et al. 2014) was calculated from the most inferior part of the ilium at the SI joint to the most prominent internal point of the contralateral acetabulum. This same measurement was drawn on the opposite diagonal and the index was calculated using the following formula: .

Results
Patient 1 Case Results
Patient 1, a 9-year-old female, sustained a pelvic fracture after falling from agricultural equipment. Her injuries included a vertical shear type pattern with disruption of the right sacroiliac joint and the pubic symphysis. She underwent open reduction internal fixation of the pubic symphysis and closed reduction, percutaneous screw fixation of the right SI joint at the S2 level. 3D renderings including hardware are found in Figure 2.
_pre-operative_segmentation_ b)_post-operative_segmentation_c)_.png)
Patient 1’s measurements were made on plain radiographs and single cut CT demonstrated a 13.4 mm improvement in pubic symphysis diastasis, 11.1 mm improvement in vertical displacement, and 5.9 mm improvement in injured (right) SI joint diastasis from pre- to post-operatively. Keshishyan deformity index improved from 0.14 to 0.08. In 3D models, measurements mirrored the clinical improvements but were smaller in magnitude (Table 2). There was a 10.1 mm improvement in pubic symphysis diastasis, 2 mm improvement in vertical displacement, and 3.3 mm improvement in injured SI joint diastasis from pre- to post-operatively. Modified Keshishyan deformity index improved from 0.104 to 0.034.
Patient 2 Case Results
Patient 2, a 12-year-old male, was involved in an auto versus pedestrian accident and sustained multiple pelvic fractures including left superior and inferior pubic ramus fractures, left SI joint diastasis and left iliac fractures including an anterior column acetabular fracture. He underwent open reduction internal fixation of the superior pubic ramus, the left ilium, and the SI joint with screw fixation in both S1 and S2. 3D renderings including hardware are found in Figure 3.
_pre-operative_segmentation_ b)_post-operative_segmentation_c)_.png)
For patient 2, measurements made in two dimensional images identified post-operative improvement in symphysis diastasis of 4.6 mm, with no change in vertical displacement and only a 1.1 mm change in inured (left) SI joint diastasis. Keshishyan deformity index improved from 0.15 to 0.08. In 3D models, pubic symphysis diastasis improved by 3.5 mm and vertical displacement by 2.7 mm. However, the injured (left) SI joint diastasis was noted to increase 1.2 mm, with modified Keshishyan index improving from 0.101 to 0.062 (Table 3).
Discussion
The intricate nature of pelvic anatomy is complicated by trauma, and pediatric pelvic fractures can be particularly difficult to comprehend due to comprehend due to unique fracture patterns and plastic deformity. The analysis of these injuries in standard two-dimensional imaging modalities (plain radiographs and CT) does not fully utilize the level of detail available within the raw data. 3D renderings of CT data allow for more nuanced analysis and measurement and may provide clinicians with valuable tools. Quantitatively, this technology allows practitioners to identify a point in 3D space, utilizing both the X and Y planes, as well as an additional Z axis. In clinical scenarios where millimeters of displacement or asymmetry determine treatment algorithms, for example at the sacroiliac joint or pubic symphysis, this more precise localization may impact surgical decision-making. Greater accuracy in pre-operative planning for sacroiliac screw trajectory and other high-risk implant placement is another potential application of improved visualization.
Previous use of 3D modeling has been described in the adult population to assess pelvic symmetry. Ead et al. reported that hemipelves are generally symmetric in side to side comparison within individuals and that most deviation occurs in the non-articular portions of the pelvic bones (Ead, Duke, et al. 2020). However, another study by Zhang et al. reported that almost three quarters of their models showed deviation of more than 4 mm at the iliac crests when compared side to side (Zhang et al. 2022). These studies highlight the complex anatomy of the pelvis and also may suggest morphological differences within populations. 3D modeling has more recently been suggested for use in pre-operative planning for adult pelvic trauma, with renderings of mirrored uninjured hemipelvi used to reconstruct the fractured side (Ead, Westover, et al. 2020). However, this has not been applied to the pediatric trauma population, in which injury patterns vary significantly from common adult fracture types in both location and the presence of plastic deformity (Silber and Flynn 2002).
3D CT analysis has been used to describe morphologic subtypes of acetabular dysplasia in the pediatric population and has also been commercialized to provide pre-operative planning tools for femoroacetabular impingement in adolescent and adult hip surgery (Kim and Wenger 1997; “HipMap,” n.d.). Topographic mapping can be extrapolated to overlay analysis, as demonstrated in our patients to show deviations between pre- and post-operative morphology. Future applications may involve pre-operative planning and virtual reconstruction with analysis of planned operative interventions.
In this study, we applied metrics previously described by Keshishyan, Matta and Sagi for quantifying post-traumatic deformity. We modified the Keshishyan index for use in the 3D renderings, with specific points identified on the ilium for reference. Notable differences were observed in measurements made in two versus three dimensional models, although all measurements showed improvement on injured SI joint displacement, pubic symphysis diastasis, vertical hemipelvis displacement and pelvic ring asymmetry, demonstrating the effectiveness of operative interventions. 3D renderings of post-operative pelves after trauma allows some prognostication regarding long-term outcomes. The most common symptoms of post-traumatic pelvic asymmetry are lumbar pain, Trendelenburg gait, non-structural scoliosis and sacro-iliac joint dysfunction (Smith 2005; Schwarz et al. 1998). While not every patient should undergo post-operative CT scanning, more accurate measurements of deformity can help clinicians more appropriately counsel certain patients with severe deformity on these risks.
This proof-of-concept pilot study will not change the morbidity or mortality associated with pelvic ring injuries, however this technology has the potential to enhance diagnostics and treatment planning by enabling more accurate injury classification and surgical planning. In the future, it may improve surgical precision through better navigation and guidance provided by 3D images. Additionally, 3D reconstructions can serve as valuable visual aids to explain injuries, propose surgical interventions, and prognosticate outcomes to patients and their families. Studies currently underway utilizing this technology seek to correlate post-operative fracture healing and remodeling with patient-reported outcomes. 3D modeling has the potential to guide treatment decisions, offer prognostic information to patients and families, and inspire alternative surgical techniques for improved management of these injuries.