


INTRODUCTION
High-profile medical device recalls, such as the Depuy ASR hip in August 2010 that affected an estimated 93,000 patients worldwide, have brought public attention to the gaps in postmarket device surveillance (Meier 2012). In a 2011 report, the United States (US) Government Accountability Office (GAO) called on the Food and Drug Administration (FDA) for better oversight, after examination of Class I recalls between 2005 and 2009 found that hundreds of thousands of recalled devices were not able to be located or recovered (Government Accountability Office 2011). By 2013, the FDA had announced requirements for manufacturers to label medical devices with a unique device identifier (UDI) (Unique Device Identification 2013) as a necessary step to support better device tracking, as well as to support hospital supply chain operations, patient safety, and research, particularly for implantable devices (McClellan, Gardina, Daniel, et al. 2014; The Pew Charitable Trusts 2015; N. A. Wilson et al. 2022). The UDI consists of a two-part numeric code consisting of the device identifier (DI) and production identifier (PI), and since 2013, similar UDI frameworks have been announced by the European Union and 10 other countries. Although the FDA established a timeline for all devices to be compliant with its rule by 2022, barriers to implementation have led to deferrals, exceptions, and other delays to the envisioned goal of a comprehensive ecosystem for full tracking and surveillance of all medical devices (Food and Drug Administration 2022).
Several hospital systems have reported success in tracking implants in areas such as cardiac catheterization laboratories where sterile, UDI-labeled implants tend to be barcode-scannable at the point-of-care (POC) (Drozda, Dudley, Helmering, et al. 2015; Drozda, Graham, Muhlestein, et al. 2022; Krupka, Graham, Wilson, et al. 2021). Perhaps the most significant barrier to universal UDI tracking, however, is the impracticability of labeling extremely small devices, such as small and mini fragment implants used in orthopedics. In hospitals and ambulatory surgery centers, these implants are often received in surgical trays or are removed from packages and placed into surgical trays for sterilization, after which the link between the implant and its UDI labeling is broken. As trays are replenished over the course of multiple surgical procedures on different patients, trays may also hold a mixture of implants that were added at different times and with different DI and PI information. In the past 12 months at our institution, over 28,000 implant-related surgeries were performed and between one-fourth and one-third of these involved small metallic plates and screws whose full UDI information cannot be retrieved (Homiak 2024). The scope and impact of this problem for hospitals and patients is therefore substantial.
In some cases, larger implants can be imprinted with UDI via direct part marking (DPM) or other technology, but millions of implantable screws (Fletcher, Wenzel, Neumann, et al. 2020) and plates used annually in surgeries across the country are too small for DPM. This results in a major obstacle to realizing the intended goals of patient safety, and prevents hospital supply chain management from implementing the same kind of tracking system in the operating room (OR) because of this large volume of untrackable parts (AIM North America 2023). It also creates large inventories of implants with unknown provenance that require complex and expensive dispositioning. Besides DPM, other solutions to UDI compliance for small implants have been discussed, including individual sterile-packaging all implants, which would be a major and costly undertaking that could increase patient risk, or addition of scannable markers to the surgical tray which would facilitate the capture of DI only. An approach that could track the full UDI of small implants without disrupting the current sterilization or OR workflow could be highly beneficial for many stakeholders.
We report on a study using testing of a commercially available optical system and its applicability to tracking medical device UDI. Our objective was to simulate a series of surgical procedures in order to test the accuracy and feasibility of the system to uniquely identify and track small implants. A secondary objective was a process analysis of how the solution could be implemented somewhere outside the OR.
METHODS
This study was conducted at Geisinger Medical Center, part of an integrated healthcare delivery system delivering care to over one million patients in central and northeastern Pennsylvania. Geisinger has ten hospitals, more than 1,600 primary and specialty physicians that serve the system clinics, and a single electronic health record (EHR) platform encompassing inpatient and outpatient care across its network. This study involved no human subjects and was therefore exempt from Institutional Review Board (IRB) review.
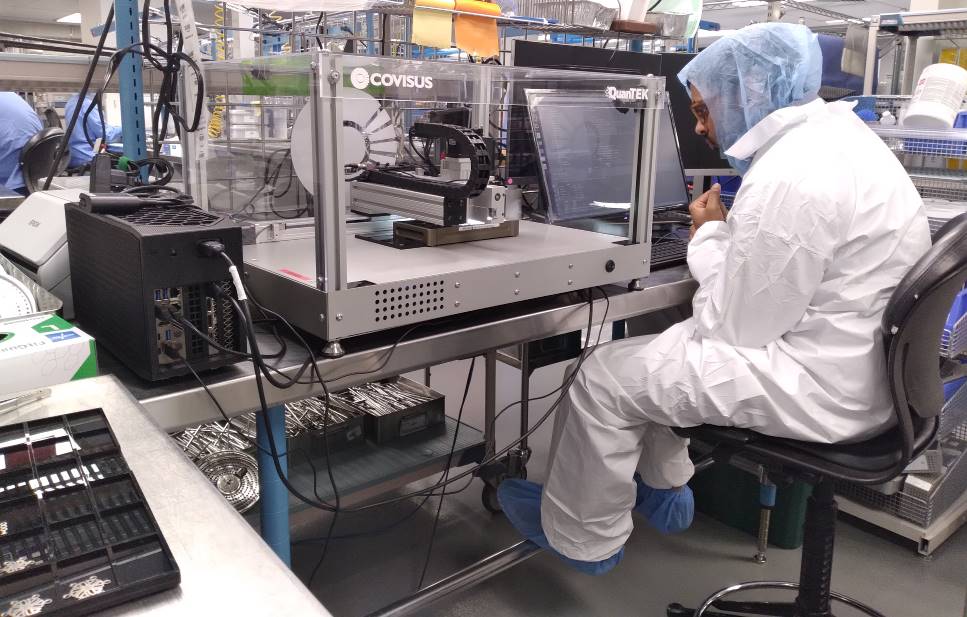
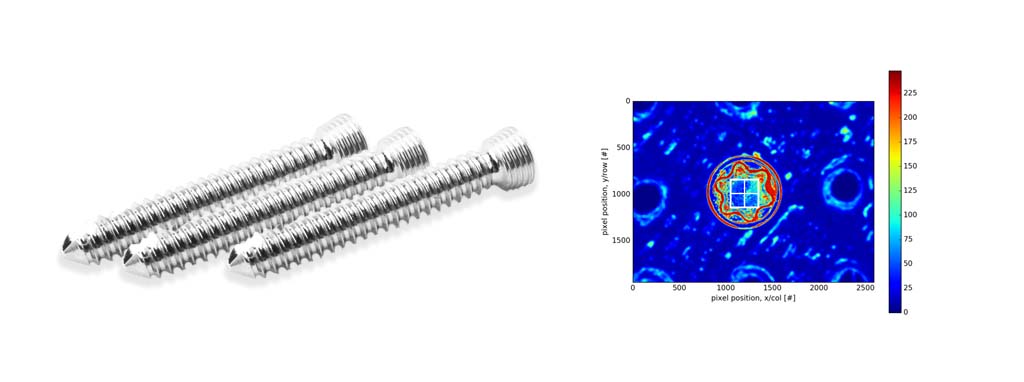
A QuanTEK system (Covisus, Inc., Monrovia, CA) was set up in the central sterile supply area of the hospital, requiring approximately a 24 by 36 inch work surface for the system and a laptop computer. The system uses a proprietary optical imaging assembly mounted onto an automated robotic platform and was developed for the Department of Defense to meet its Intrinsic Unique Device Identifier (IUDI) requirements for microelectronics and aircraft engine components (Defense Federal Acquisition Regulation Supplement 2024). At a rate of approximately one second per implant, it rapidly captures the unique surface texture of an implant at a micrometer scale and converts this to an intrinsic, immutable “fingerprint” (virtual tag, or vTag) that is linkable to other metadata such as UDI. The approach is based on the well-established scientific principle that all objects have a unique surface texture that can be used for identification (Buchanan, Cowburn, Jausovec, et al. 2005). Using this technology, an implant can be separated from labeling or other identifiers, because whenever its surface is scanned again, the vTag fingerprint is used to match to its metadata using a statistical algorithm. Figures 1a and 1b show the system in use and a sample vTag fingerprint image, respectively.
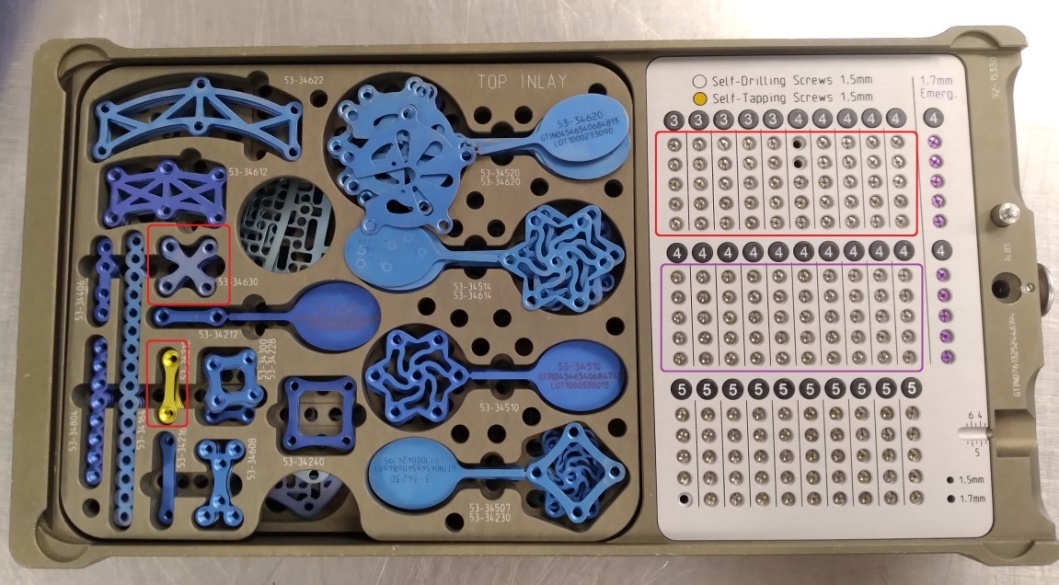
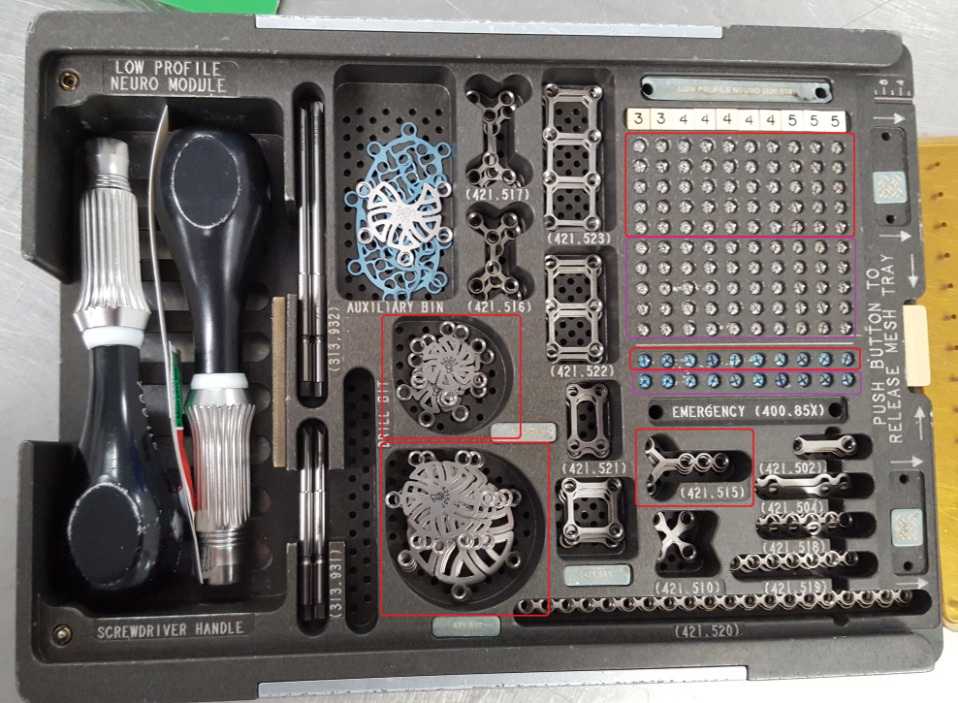
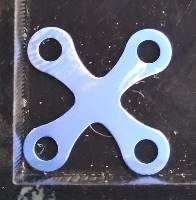
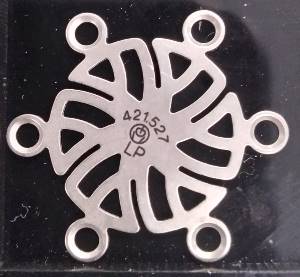
From the hospital’s inventory, we selected two craniotomy trays from different manufacturers: (1) the Universal Neuro III (UNIII) kit (Stryker Corporation, Kalamazoo, MI) and (2) the Low Profile Neuro kit (LPN) (Depuy Synthes, Warsaw, IN). Trays had been populated by the hospital staff with implants, cleaned and sterilized, and were ready to be used for surgery. For this study, we chose eight different screw types, three plate types, and two burr hole cover types to test applicability of the system to a range of geometries, materials and surfaces, as described in Table 1. In addition to the surgical trays, we also utilized a generic plastic tray, which could be used for any implant geometry, for overhead scanning of plates and burr hole covers that were stacked in the surgical tray. All trays are shown in Figure 2, and close-up photos of the implants are shown in Figure 3.
Templating and Registration
The optical system’s camera moves along a horizontal plane, viewing each implant’s surface from above and selects areas to scan to create the vTag based digital fingerprint. The first step of the process, therefore, was to create a software template for each implant type geometry and to calibrate these templates. Because the eight screw types were similar in shape and size, they could be processed with one template, and five additional templates were needed for the three types of plates and two types of burr hole covers. Once templated, every individual implant was registered with a unique fingerprint (vTag) by scanning its surface. Screws could remain in the surgical tray for scanning, while plates and burr hole covers (which were stacked in the surgical tray) were temporarily transferred to the aforementioned generic plastic tray to make them visible for overhead scanning. A total of 236 unique implants were registered during this step and assigned unique identification numbers, similar to UDIs, with no errors in registration.
Surgical Simulation
Once registration was completed, we performed a series of 16 simulated craniotomy surgeries, 8 with each tray. For each manufacturer’s tray, the registered implants in one area of the tray were designated as available for the next surgery and implants outside that area were held in reserve for replenishing consumed implants after each surgery. For the UNIII tray, 50 screw positions (in a 5x10 grid) were scanned after every surgery, and for the LPN tray, 60 screw positions (5x10 grid, plus an additional row of 10) were scanned each time. As before, stacked plates and burr hole covers were transferred to a generic plastic tray for scanning, and between 3 and 9 positions in this tray were scanned, depending on how many implants were used.
During each simulation, some implants were removed from the tray to represent consumption (e.g., implantation), and other implants were removed then returned to a different location (e.g., to represent screws that were tried, rejected and replaced). Screws were moved using the manufacturers’ screwdrivers, while plates and burr hole covers were moved with generic surgical tweezers. To prevent bias, the QuanTEK scanning team member (RM) could not observe what the surgical team members (JG, JA) were doing during surgery, and an algorithm was devised using a 10-sided die (Chessex, Fort Wayne, IN) and random number generator (Random.org, Dublin, IRL) to randomly select which implants were consumed or moved each time. The identities and locations of all implants were recorded in the notebook of the surgical team. At the end of each surgery, consumed implants were set aside, and new screws or plates from the replenishment area of each tray could be moved into empty locations in the active area of the tray. Because of the relatively limited number of LPN plates and burr hole covers compared to the other types of implants, those implant types were re-used instead of being set aside and replenished.
Verification of Components Consumed or Moved
After each cycle, trays were then returned to the QuanTEK scanner in order to verify the locations and identities of all implants and compare them with the previous scan to determine which had been consumed, moved, or added during the surgery and replenishment. A report was generated by the scanning team member that was later compared against the notes from the surgical team members to verify the accuracy of all implants’ unique identities. After the first post-surgical verification scan, the replenished tray was sent back to the surgical team to perform the next simulated surgery, and these two steps were repeated for each tray until both had undergone eight cycles of surgery and verification each (total of 16). Note that although only 236 unique implants were registered, non-consumed items were scanned multiple times over the course of the 16 surgeries, resulting in a total of 953 implant scans performed altogether.
After the completion of the last cycle, the system was used once more to verify the identities of all 236 registered implants and return them to their exact, original locations in the surgical trays before returning those trays to the hospital staff for re-sterilization and patient use.
RESULTS
Over the sixteen simulated surgeries, we accurately identified the location and unique identity of implants 100% of the time, with no errors (953 out of 953 implant scans performed; 853 screws, 62 plates, and 38 burr hole covers scanned; 95% confidence interval = 99.6 to 100%). By comparing each scan with the previous one, the scanning team therefore detected with 100% accuracy the consumption of 53 screws, 27 plates and 18 burr hole covers, the movement of 45 screws, 6 plates, and 4 burr hole covers, and the replenishment of 52 screws and 12 plates. Table 2 provides more details of these experiments.
This project was completed over two days, January 23 and 24, 2024. On the first day, approximately 3.5 hours was spent creating and calibrating the six geometric templates for the component types selected. Two hours were used to do the initial scanning and registration of all 236 implants in the study to create their unique fingerprints and identification numbers. Sixteen simulated surgeries were performed over the course of approximately six hours, with the turnaround time from one verification scan to the next taking an average of 7 minutes (minimum 3, maximum 14, standard deviation 3.1 minutes).
DISCUSSION
Our results demonstrate that under simulated conditions, the QuanTEK optical system was able to track the unique identities of very small implants (as small as screws with 1.5mm nominal diameters, 2.84mm diameter heads) through a series of surgeries with 100% accuracy. These simulated surgeries utilized 13 different implant types from two different manufacturers, and results suggest that this technology could provide hospitals with a robust solution to tracking the full UDI (DI and PI) of all implantable medical devices used in ORs, including the smallest implants. Logistical questions remain for further exploration and consideration to expand this work to a final, generalizable, scalable solution, but these results suggest that the workflow is highly feasible for being deployed in a hospital system.
Our study also suggests that all scanning and verification could be performed away from the OR in a location such as central sterile supply. In our hospital, the central sterile department is where implants are first removed from their labeled packaging, and so it makes sense that the registration process could take place there. In our project, implants had already been unpackaged, and we therefore assigned fictitious UDI’s to the implants as we registered them. In practice, however, a barcode scanner could be used to assign the actual UDI to every implant as it is removed from its labeled packaging. For verification and identification of implants, the FDA has required UDI to be available at the point-of-care with the patient (Gross and Food and Drug Administration 2016), but post-surgery scanning would not necessarily need to take place in the already crowded, high-pressure environment of the OR or create additional work for surgical staff (N. Wilson, Jehn, Kisana, et al. 2020). Information systems would need to be interfaced to reconcile the verification scans with the patient’s surgical reports to capture the full DI and PI of what was consumed. The distinction between implants being placed in a patient versus being wasted or lost would also have to be incorporated into information systems as well. Building those interfaces should not be a major challenge, however, and in fact it could improve patient safety and inventory management by providing a validation/verification step (Tcheng et al. 2021; Reed et al. 2017).
In this demonstration, each scan of a tray with 50-60 screws or 6-7 plates or burr hole covers required between 5 and 10 minutes, which is not insubstantial. The actual imaging of each implant was only approximately 1 second per implant, but additional time was needed for loading trays into the scanner, moving the scanner between implants, calibration, and other activities for this demonstration. Given that this was the team’s first encounter with the specific surgical trays and parts used in this trial, we adopted a more tolerant and therefore slower procedure for imaging the implants. It is reasonable to expect that additional experience with each type of implant to understand the tolerances required would allow further optimization and reduction in scanning time. For scaling up of this system, calculations would certainly be needed to assess the number of ORs in the hospital, the number of cases and trays per hour or per day that would need to be scanned, and the resulting number of scanners needed. Based on our experience within our single hospital, we believe that central sterile supply would be the best candidate for having the space required for these scanning workstations, and scanning time there should have no impact on surgical time in the OR.
We note that the optical scanning technology does rely on the integrity and visibility of the surface being scanned. In our study, we intentionally used surgical tools whenever picking up screws, as a test of whether the contact between the tool and screw head would potentially alter the surface on a micrometer scale; however, we encountered no instances where this contact prevented the screws from being accurately identified. In preliminary work, we had also established that vTags were not affected by moist heat sterilization cycles. In this study, we did temporarily transfer stacks of plates and burr hole covers to a separate, compartmentalized tray to make them all visible, which required more time than scanning screws in the surgical tray, but we were able to distinguish between the top and bottom surfaces of each one, and so we standardized how implants were oriented in the tray. For plates or other implants that could have multiple orientations in the tray, as opposed to screws which always have the same vertical orientation when placed into holes, there could potentially be a problem if the optical scanner cannot see the same surface of the plate that was initially fingerprinted. In those cases, it would be necessary either to establish standard rules on how the surfaces are oriented for scanning, or to create ‘fingerprints’ on multiple surfaces.
The primary strengths of this study are that we showed the reliability of this tracking system through many repetitions and used 13 different implant types from two manufacturers that represented different sizes, geometries and materials (e.g., pure titanium vs. titanium alloy). We acknowledge a few important limitations. First, although the simulations involved removing, moving, and adding components to the tray, these were not real surgeries, and the trays did not undergo a cycle of actual cleaning and moist heat or steam sterilization between experiments. Preliminary data collected after an actual surgery earlier in the year informed the design of this study, but it is possible that there could be unforeseen consequences or environmental factors that arise during repeated surgeries that will need to be evaluated in future work. We also acknowledge that, despite the range of implants tested in this study, further testing would be needed on other types of implant designs and materials not represented here to establish further generalizability.
Our demonstration shows the applicability of a commercially available optical system for tracking the full UDI of small implants through hospital ORs. Such an approach could eliminate the current practice of directly marking UDI information onto an implant and scanning it in the OR, which is a major challenge for millions of small implants that are currently being granted exceptions by the FDA. Future work will be important to further establish the generalizability and scalability of the system for real-time hospital use to fulfill the promise of improved patient safety and supply chain management through better identification of medical devices.
ACKNOWLEDGMENTS
The authors wish to thank the staff of Geisinger Medical Center’s central sterile supply, including Kyle Rice, Melania Balzer, Kristin Hagerman, and Corey Buck, for their assistance with this study.
FIGURE AND TABLE CAPTIONS
Figure 1. Sample images of the QuanTEK system. (a) The QuanTEK system in use, installed on a workbench in the Central Sterile Supply area of the hospital. (b) Image processing algorithms convert the 2-D image of a screw head into a texture map that is then converted into a digital fingerprint.
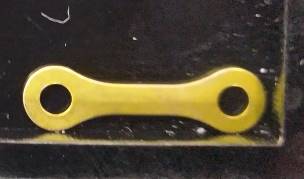
Figure 2. Overview of trays used for scanning. Red outlined areas on the surgical trays indicate the plates and the area of the screw grid that were designated as available for use in each surgery, while the purple-outlined area indicates the area where screws were held in reserve for replenishment. (a) Stryker UNIII kit. (b) Depuy Synthes LPN kit. (c) Generic plastic tray for overhead scanning of plates and burr hole covers.
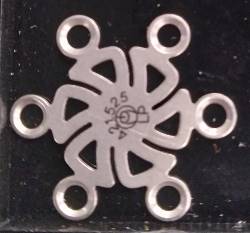
Figure 3. Close-up photos of implant types used. (a) Stryker UNIII screws (nominal 1.5mm thread diameter, 2.84mm screw head diameter), shown with objects for scale. (b) Stryker UNIII X-plate, (c) Stryker UNIII dog-bone plate, (d) Depuy Synthes LPN Y-plate, (e) Depuy Synthes LPN 12mm burr hole cover, and (f) Depuy Synthes LPN 17mm burr hole cover.