


Introduction
Total joint arthroplasty (TJA)[1] continues to be one of the most performed orthopedic procedures, providing a solution that enhances the quality of life for individuals suffering from age-related degenerative diseases such as osteoarthritis (Ritter et al. 1995; Jones et al. 2005; Tarakji et al. 2018). As the elderly population continues to grow, the increased requirement for joint replacements continues to place a large burden on hospital systems and healthcare providers (Administrator for Community Living 2021). In 2022, total hip and knee procedures alone accounted for 2.8 million procedures performed in the United States, reflecting a procedural volume growth of 14% compared to the previous year (Hegde et al. 2023). Medicare, covering more than 18% of the United States’ population, stands as the primary payer for inpatient encounters (El-Nahal 2020). Given that Medicare reimbursements significantly contribute to a surgeon’s income, the reimbursement rates have the potential to impede patient access to care by disincentivizing surgeons from performing certain procedures (Feng et al. 2020). The question of whether Medicare reimbursement for TJAs continues to be economically practical for surgeons remains. The goal of this study is to examine the temporal trends in Medicare reimbursement for all TJA procedures from 2013-2021, understand differences between procedure types, and compare regional reimbursement rates to gain insight into the potential impact of recent trends on future reimbursement dynamics.
Methods
Data Source and Variables of Interest
Data regarding joint replacements from 2013-2021 was collected from the Centers for Medicare & Medicaid Services Database, which provides information on provider utilization and payments for procedures by provider (Centers for Medicare & Medicaid Services Data, n.d.). To adjust monetary values for inflation, the Consumer Price Index was used as provided by the Bureau of Labor Statistics Database (U.S. Bureau of Labor Statistics, n.d.). For regional analysis, data obtained from the Medicare database was divided into four regions based on the predefined Census Bureau regions (Northeast, Midwest, West, and South) (“Census Regions and Divisions of the United States,” n.d.).
The Medicare database was queried using the following Healthcare Common Procedure Coding System (HCPCS) codes: 27130 (total hip arthroplasty), 27447 (total knee arthroplasty), 27702 (total ankle arthroplasty), 23472 (total shoulder arthroplasty), 24363 (total elbow arthroplasty), and 25446 (total wrist arthroplasty). These data were then extracted for the years 2013-2021 as available.
Demographic, provider utilization and reimbursement variables were collected from the filtered data. Demographic variables included location by state. Utilization and reimbursement variables included total beneficiaries, total services, total submitted charge, and total Medicare payment.
Data Analyses
Monetary values including total submitted charge and total Medicare payment were adjusted for inflation such that all values were adjusted for 2021 inflation values. All statistical analyses were performed using adjusted monetary values. For comparison of beneficiaries and average adjusted reimbursement between 2013 and 2021, Welch’s t-test was employed, with an adjusted P-value applied to correct for multiple comparisons. To assess the significance of temporal trends in reimbursement and beneficiaries by region, linear regression analysis was conducted. Analysis of variance, followed by Tukey’s Post-Hoc test, was employed to identify significant differences between regions concerning reimbursement and beneficiaries. Adjusted P-values, correcting for multiple comparisons, were also computed for this analysis.
Results
Overall Medicare Reimbursement for Total Joint Replacement Procedures
The total number of beneficiaries in 2021 were TSA (70,525), THA (233,059), TKA (511,546), and TAA (767). The mean adjusted Medicare reimbursement for these procedures in 2021 was TSA ($783.82), THA ($839.17), TKA ($881.40), and TAA ($609.90). For TEA and TWA, the most recent data was for 2019 which indicated 23 and 11 total beneficiaries and an average reimbursement of $1,842.68 and $1,536.02, respectively.
When comparing the most recent 2021 mean payments to 2013 values, TSA (23472) had the greatest percent reduction (-51.23%) in reimbursements with all procedures significantly (p<0.001) declining in mean Medicare payment (Table 1). The percent change for both 2013 and 2021 were also examined regarding total beneficiaries with TSA demonstrating the greatest percent increase (124.42%, p<0.001). THA (27130) and TKA (27447) both also had significantly increased total beneficiaries (p<0.01), while TAA (27702) had an insignificant increase (34.09%, p=0.627) over the study period.
Regional Analysis of Total Joint Replacement Reimbursement
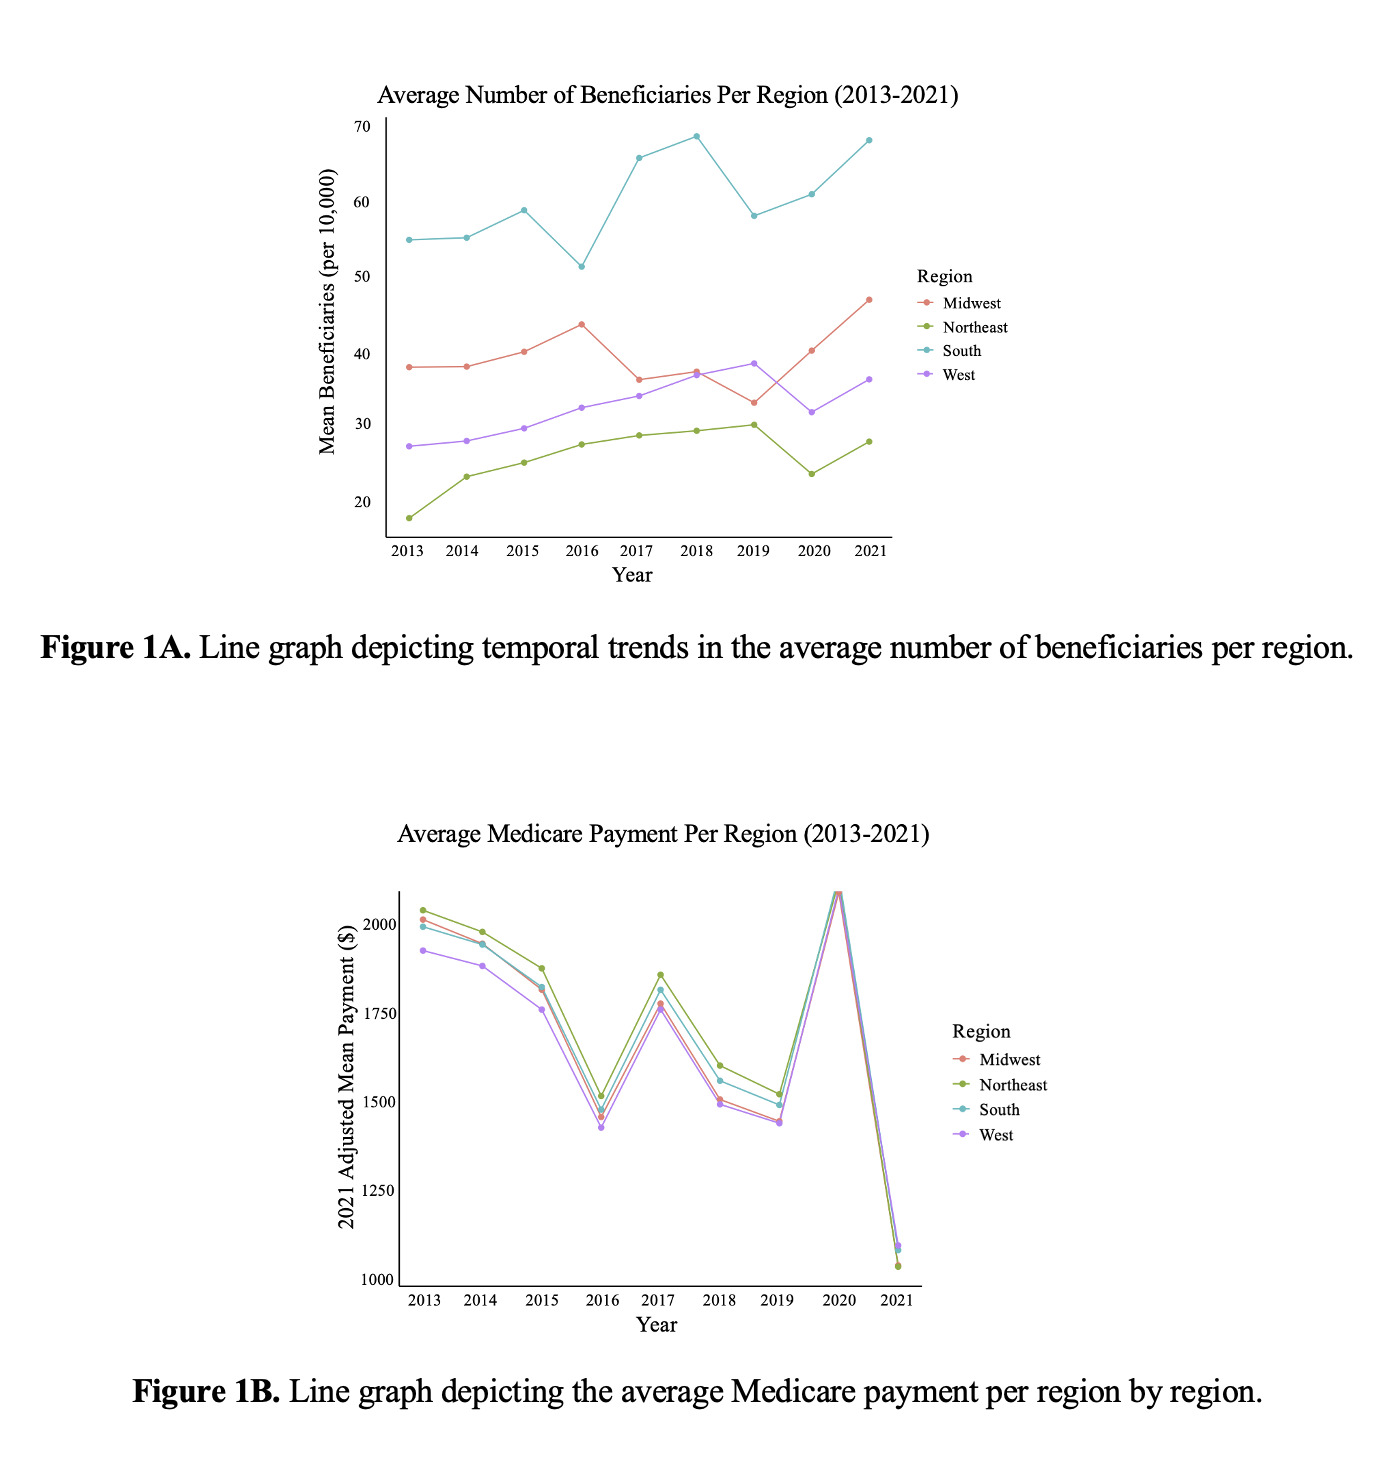
The Northeast region had the greatest mean Medicare payment ($1,731.09), while the South had the highest number of mean beneficiaries (60,224) for TJAs over the study period. For all regions, the mean Medicare payment for TJA decreased significantly from 2013-2021 (p<0.05), with the largest decrease per year seen within the Northeast region ($-61.88 per year) (Figure 1A-B). For beneficiaries, all regions increased insignificantly, with the South having the largest increase per year (1,440, p=0.723). Mean adjusted submitted charge decreased significantly for all regions (p<0.001) across the study period (Table 2).
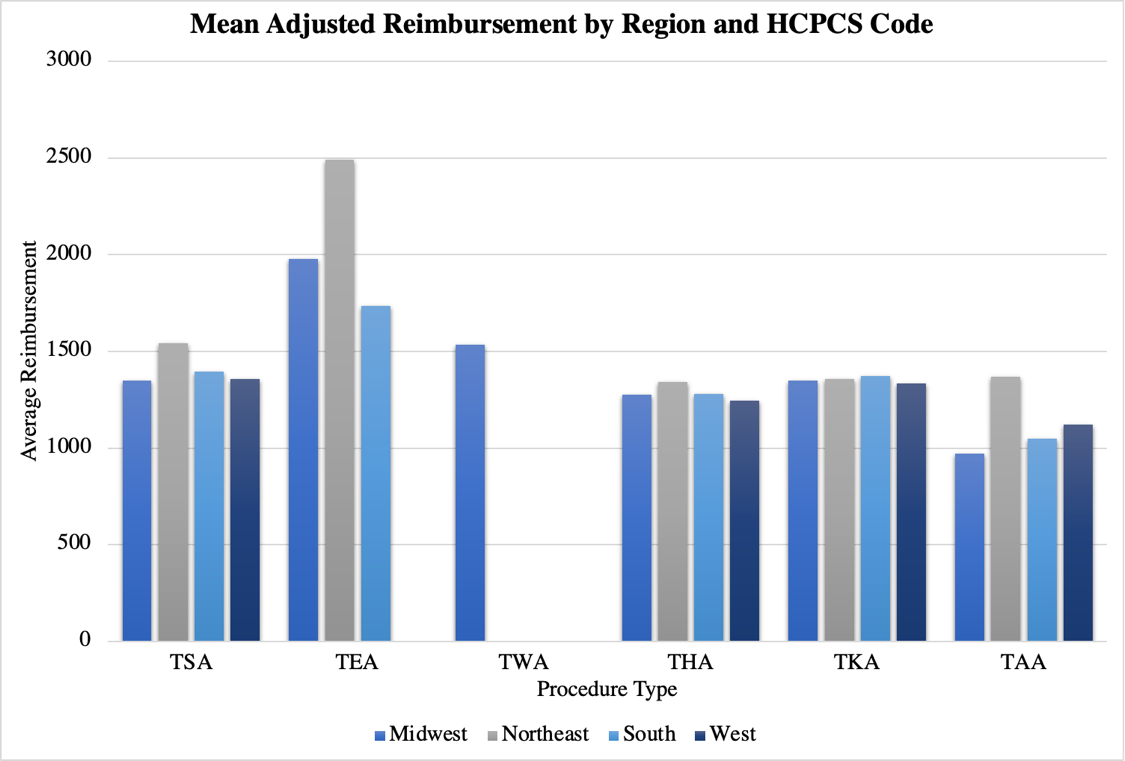
A regional analysis for mean Medicare payment, mean beneficiaries, or mean adjusted submitted charge per year, stratified by procedure type was also performed (Figure 2A-C). For TAAs, there was a significantly higher mean Medicare payment seen in the Northeast compared to the Midwest ($1,367.88 vs. $971.10, p=0.02). For TEAs, the Northeast had a significantly greater mean Medicare payment compared to the South ($2,489.32 vs. $1,734.69, p=0.04). There were no other significant differences in Medicare payment between any region for all other procedures.


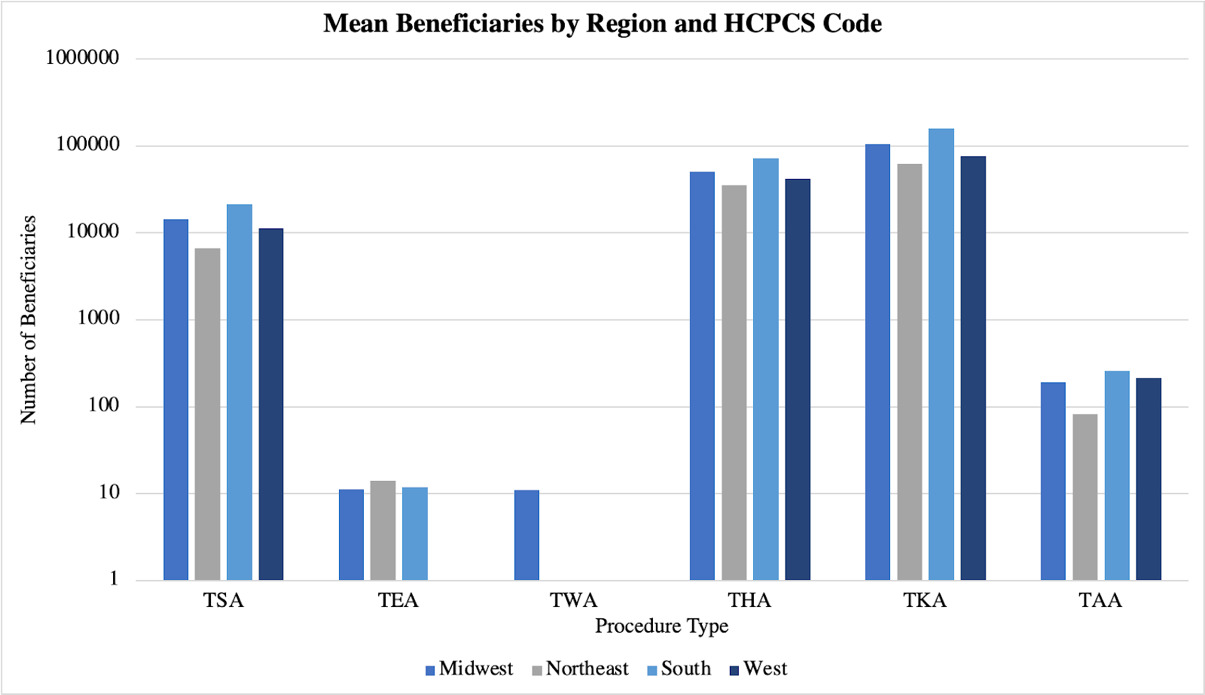
Regarding mean beneficiaries per year (Figure 2B), the South had the greatest number for all procedure types. For TSA, THA, and TKA, there were significantly more mean beneficiaries per year in the South than all other regions (TSA: 21,227 p<0.01; THA: 72,572 p<0.001; and TKA: 106,229 p<0.001). The South exhibited the highest average number of beneficiaries for TAA (261), which was significantly greater than the Northeast and Midwest (p<0.05), but not the West (p=0.269). The Northeast region had the highest mean beneficiaries per year (14) for TEA, significantly greater than the Midwest (p<0.05). It was insignificant when compared to the South, and there was no analysis conducted for the West due to insufficient data. There was not enough data to perform an analysis for TWAs.
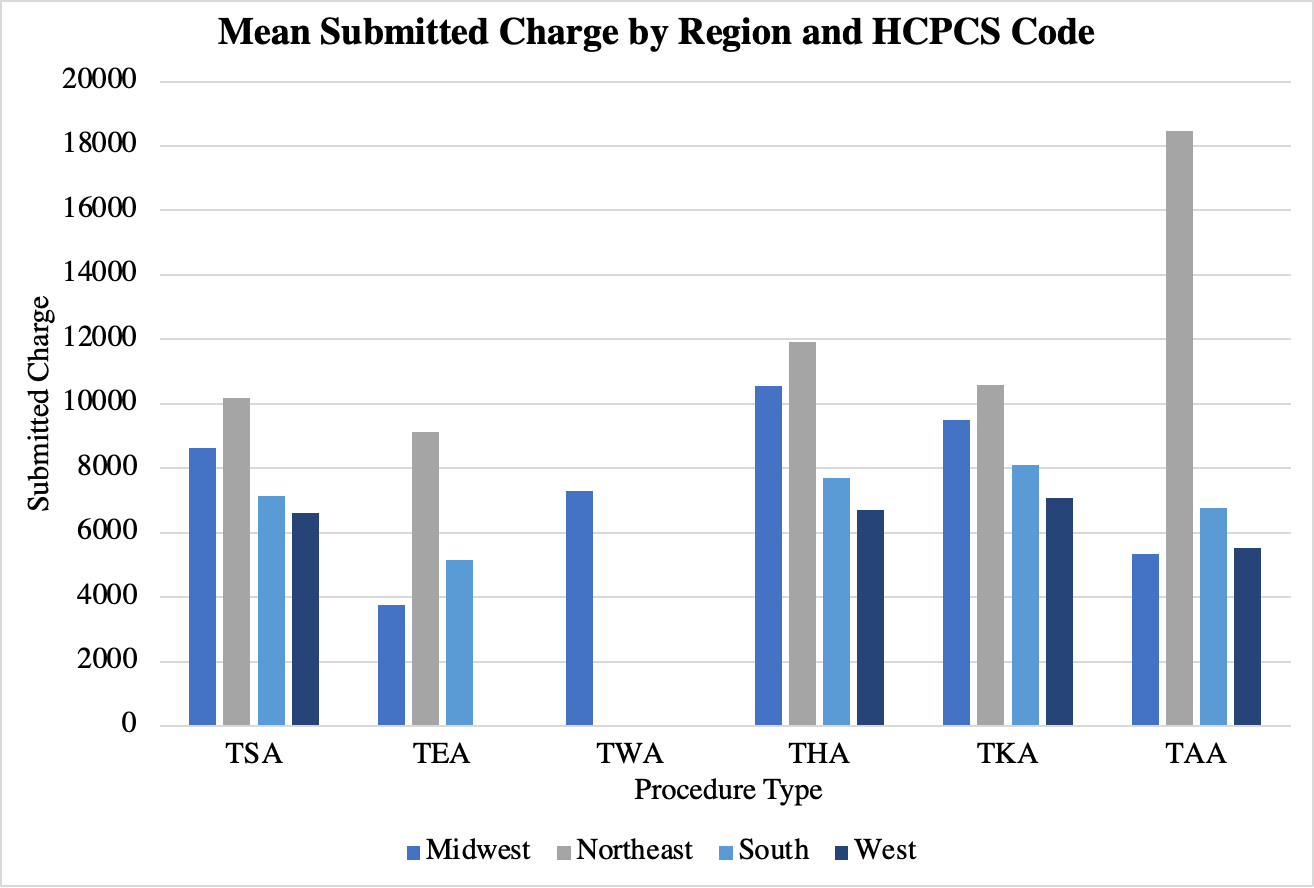
Finally, the Northeast region had a significantly greater mean adjusted submitted charge compared to all other regions for TAAs ($18,477.97, p<0.001) and TKAs ($10,591.91, p<0.05) (Figure 2C). In the Northeast, the highest submitted charge for TSAs also was seen ($10,172.63), which was significantly higher than both that of the South and the West (p<0.01). Similarly, for THAs, the submitted charge for the Northeast ($11,914.96) was significantly higher than all regions except the Midwest (p<0.01).
Discussion
As the elderly population of the United States continues to grow, the number of total joint replacement procedures is expected to rise (Shiels et al. 2021; Singh et al. 2019). In fact, THA and TKA procedures are expected to rise by 176% and 139% by 2040, respectively (Shichman et al. 2023). Even with an increase in the number of procedures, the literature has documented a significant decline in Medicare reimbursement to physicians in both surgical and non-surgical specialties (Pollock et al. 2020; Schartz and Young 2021). Consequently, this study sought to comprehensively evaluate the trends for various total joint replacement procedures. The results of this study demonstrate that there has been an overall significant decrease in Medicare reimbursement for all TJAs considering an increase seen in the number of beneficiaries, especially for TSAs. Moreover, notable regional variations are evident (Fisher et al. 2003), particularly in the Northeast where Medicare payment reductions surpass those in other regions.
Overall, we observed a nationwide decrease in the reimbursements for TJAs. This trend appears to stem from reduced costs associated with joint implant costs and a decrease in hospital expenditures for post-acute care (Navathe et al. 2018). When it comes to individuals receiving adequate medical care, accessibility plays a pivotal role. The geographical proximity between provider and individual is a major factor, as people cannot access care if facilities do not exist in their geographic area (National Academies of Sciences, Engineering, and Medicine et al. 2018). Increasing the number of healthcare providers in a geographical area has the potential to increase accessibility to care. Zmistowski et al explored this concept, finding that there was a 28.6% increase in the total number of surgeons performing more than 10 TSAs per year in the Medicare population. This surge in availability resulted in over 95% of the population being served within a 200-kilometer radius of each surgeon, aligning with our findings which showed a 124.42% increase in TSA beneficiaries (Zmistowski et al. 2018). The principles of supply and demand are evident in this context, as increased availability could be a contributing factor to the decline seen in procedure costs. Between 2011 and 2017, there was a notable 103.7% rise in primary shoulder arthroplasties (Wagner et al. 2020). Over the past years, operating time and surgical efficiency have increased, leading to potential drops in procedural rates and subsequent reimbursements (Testa et al. 2022).
Regarding hospital size and accessibility regarding joint care, in 2013, the Centers for Medicare and Medicaid Services (CMS) took a significant step by expanding the voluntary bundled payment nationwide through the Bundled Payments for Care Improvement (BPCI) initiative (Navathe et al. 2018). The initiative aimed to streamline payments for patients, particularly focusing on major joint replacement of the lower extremity, where hospitals bundled hospitalizations and incorporated up to ninety days of post-acute care into their payment structures (CMS.gov 2021). Following reports of financial savings with BPCI, CMS introduced the Comprehensive Care for Joint Replacement Model in 2016. This model mandated hospitals to bundle joint replacement procedures, aiming to enhance efficiency and quality of care delivery (Centers for Medicare and Medicaid Services 2015). However, this model has faced criticism for its potential to place an unfair financial burden on hospitals, particularly for care provided outside the hospital setting. This criticism is especially important for hospitals with low-procedure volume, as it could deter them from performing the necessary procedures and ultimately hinder patient access to essential care services (Ibrahim, Kim, and McConnell 2016). As we move forward, the ongoing assessment of insurance and governmental policies will be necessary, given the dynamic nature of our population and the diverse needs of rural and urban areas. Furthermore, addressing specific regional trends will be essential to ameliorate patient care and outcomes.
In general, the Northeast region consistently saw the highest procedural costs in the United States, primarily influenced by the elevated cost of living and the Medicare Geographic Practice Cost Index (Committee on Geographic Adjustment Factors in Medicare Payment et al. 2011). The index is an integral component of the Medicare payment system for physicians, used to adjust the relative value units of services (Seidenwurm and Burleson 2014). In the calculation of Medicare reimbursement rates, factors such as physician work, practice expenses, and liability expenses are considered (“RBRVS Overview” 2024). Once the relative values have been determined, they are adjusted to ensure Medicare does not overpay or underpay by region (Committee on Geographic Adjustment Factors in Medicare Payment et al. 2011). These intertwined factors contribute to a scenario where medical procedures, treatments, and healthcare services command higher prices in comparison to other regions. The cost of living directly impacts healthcare expenses, shaping the pricing structure for procedures. Upon regional data analysis, we observed a noticeable difference in reimbursement rates with the Northeast region registering the highest average of $1,731.09. When comparing the four regions, there was a notable distinction in the standard cost of living, with 60% of the top 10 states with the highest cost of living situated in the Northeast (Rothstein 2024). Consequently, individuals and healthcare providers in this region face unique challenges arising from the complex interplay of these factors, prompting ongoing discussions and initiatives aimed at addressing healthcare affordability and accessibility in the Northeast.
Limitations
Although this study sought to thoroughly examine trends in Medicare reimbursement for various total joint replacement procedures it is not without limitations. This study relied solely on HCPCS codes, data may be subject to inaccuracies due to data entry with coding or billing. However, it has been shown that the CMS is relatively accurate thus these mistakes are expected to be minimal. Additionally, by utilizing Medicare data this study did not evaluate trends in payment billed to patients with private insurance. As it has been reported, private insurance reimburses physicians at a higher rate, hence the trends presented in our study may not accurately represent payment for physicians primarily billing solely to private insurance. It is important to note that there was incomplete or minimal data regarding TEA and TWA rendering it difficult to draw conclusions for these procedures. Finally, although most joint replacement procedures are indicated for elderly patients secondary to pathologies such as osteoarthritis, there may be a subset of those under 65 years of age who would not be included in the CMS database, and thus not included in the results of our study.
Conclusion
The projected increase in the United States’ elderly population has created a rapidly growing need for various total joint replacement procedures, putting a rising demand on orthopedic surgeons. There is a clear decline in reimbursement rates across all included total joint procedures however the number of beneficiaries has only increased. This trend is also demonstrated across all regions of the United States with the most notable overall decrease seen in reimbursement within the Northeast region. Future studies should seek to understand the effect of these trends on orthopedic surgeons both individually and as a profession. Further, by identifying contributing factors to these trends, actionable measures may be taken to allow fair compensation for orthopedic surgeons as demand rises.
TJA: total joint arthroplasty, HCPCS: healthcare common procedural coding system, THA: total hip arthroplasty, TKA: total knee arthroplasty, TAA: total ankle arthroplasty, TSA: total shoulder arthroplasty, TEA: total elbow arthroplasty, TWA: total wrist arthroplasty, BPCI: Bundled Payments for Care Improvement, CMS: Centers for Medicare and Medicaid Services